
Bitcoin has been steadily climbing since crossing the $60,000 mark and is currently hovering closer to the $70,000 level, a price it hasn’t reached in months. With the market sentiment heating up, investors are wondering whether Bitcoin has the strength to reach new all-time highs or if it will struggle to break past key resistance levels.
A Healthy Sentiment
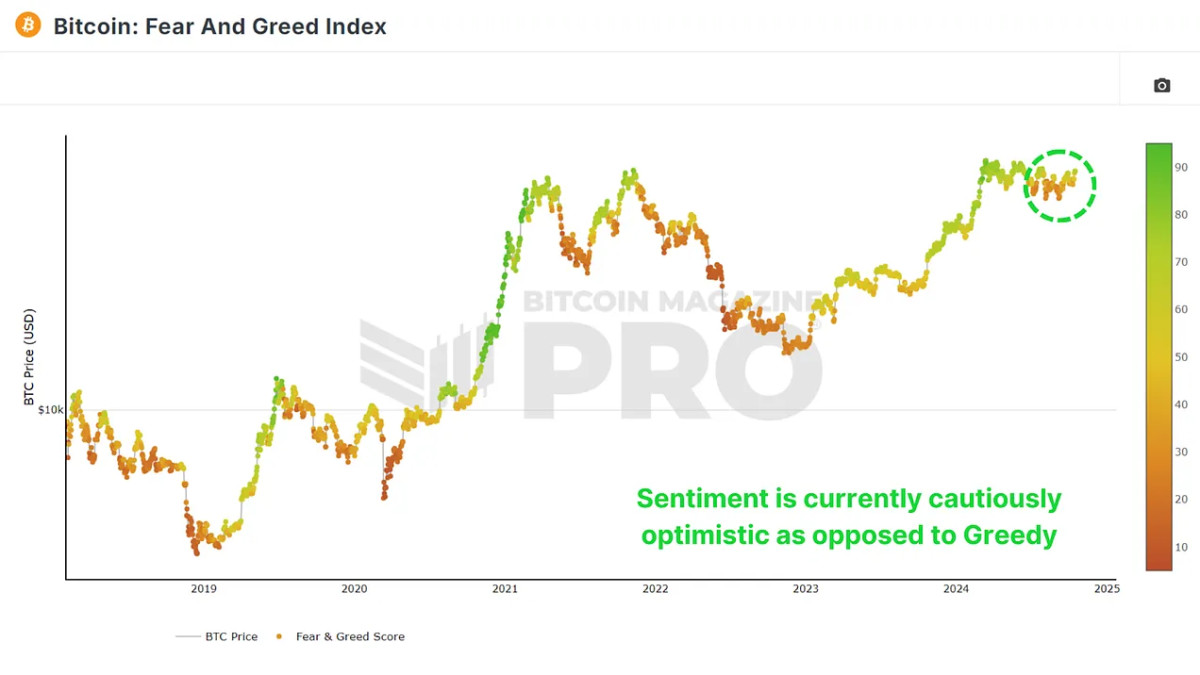
The Fear and Greed Index is a useful tool for understanding market sentiment and how traders view the trajectory of Bitcoin. Currently, the index is at a “Greed” level of around 70, which is historically seen as a positive sign but still a fair distance from the extreme greed levels that could indicate a potential market top. This index measures emotions in the market, with lower levels indicating fear and higher levels suggesting greed. Typically, when the index surpasses the 90+ range, the market becomes overly bullish, raising concerns of overextension.
It’s important to note that last year, when the Fear and Greed Index reached similar levels, Bitcoin was trading at around $34,000. From there, it more than doubled to $73,000 over the following months.
Key Support
The Short-Term Holder Realized Price measures the average price new Bitcoin investors have paid for their bitcoin. It’s crucial because it often acts as a strong support level during bull markets and as resistance during bear markets. Currently, this price sits around $62,000, and Bitcoin has managed to stay above it. This is a promising sign, as it shows that newer market participants are in profit, and Bitcoin is holding above a crucial support zone. Historically, breaking below this level has led to market weakness, so maintaining this support is key to any continued rally.
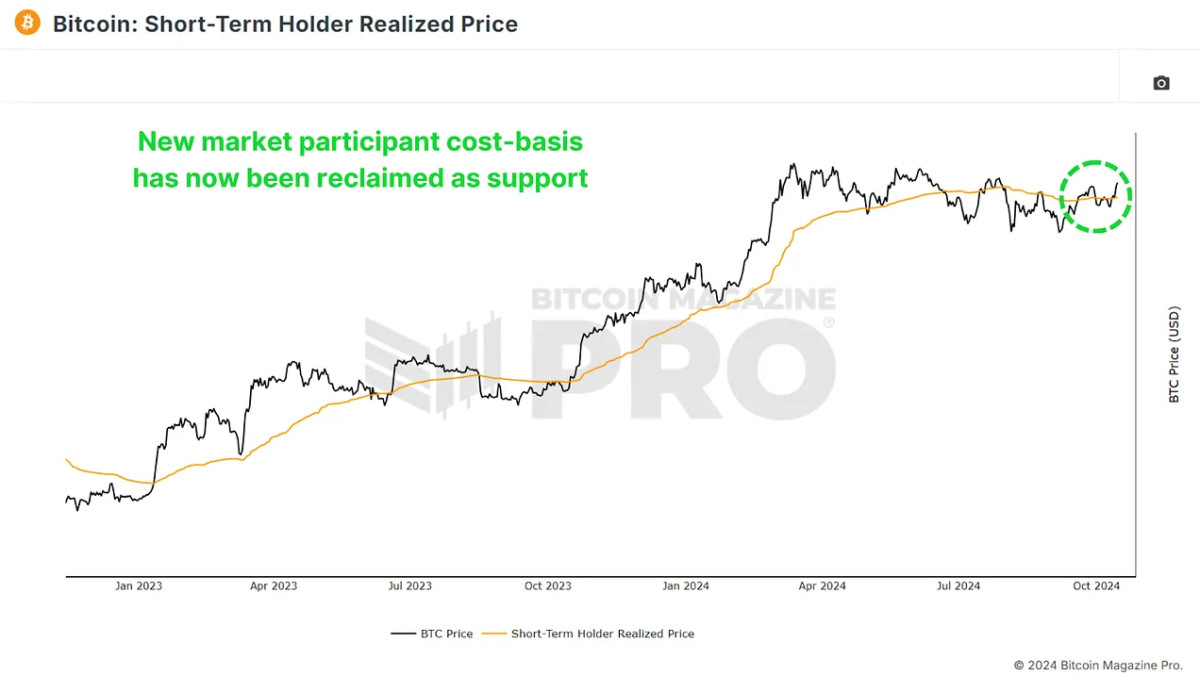
We’ve seen this dynamic in past cycles, especially during the 2016-2017 bull market, where Bitcoin retraced to this level several times before continuing its climb. If this trend holds, Bitcoin’s recent breakthrough could provide a foundation for further gains.
Stabilizing Market
One area that traders often watch is Funding Rates, which indicate the cost of holding long or short positions in Bitcoin futures. Over the past few months, funding rates have been volatile, swinging between overly optimistic long positions and overly bearish short positions. Thankfully, the market has now stabilized, with funding rates sitting at neutral levels. This is a healthy sign as it suggests traders aren’t overly leveraged in either direction.
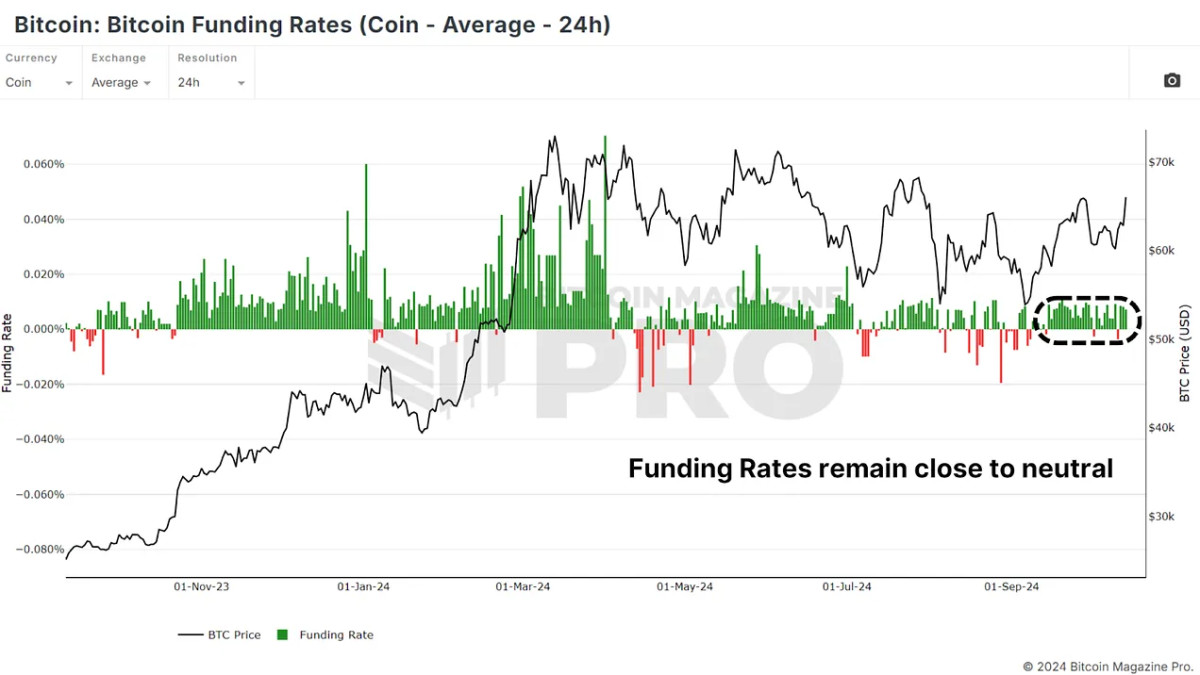
In neutral territory, there’s less risk of a liquidation cascade, a common phenomenon when over-leveraged positions get wiped out, causing sharp market drops. As long as the funding rates remain stable, Bitcoin could have the breathing room it needs to continue rising without major volatility.
A Tough Path to $70,000 and Beyond
While the market sentiment and technicals suggest that Bitcoin is in a healthy place, there are still significant levels of resistance above. First, the current resistance trend line is one that Bitcoin has struggled to break. This downtrend line has been tested several times, but each time, Bitcoin has retraced after hitting it.
Beyond this, Bitcoin faces several additional barriers, such as $70,000. This level has acted as resistance in the past and represents a psychological level that traders will likely be watching closely. And above that the all-time high between $73,000 and $74,000. Breaking this would be a major bullish signal, but it could take several attempts before Bitcoin clears this level.
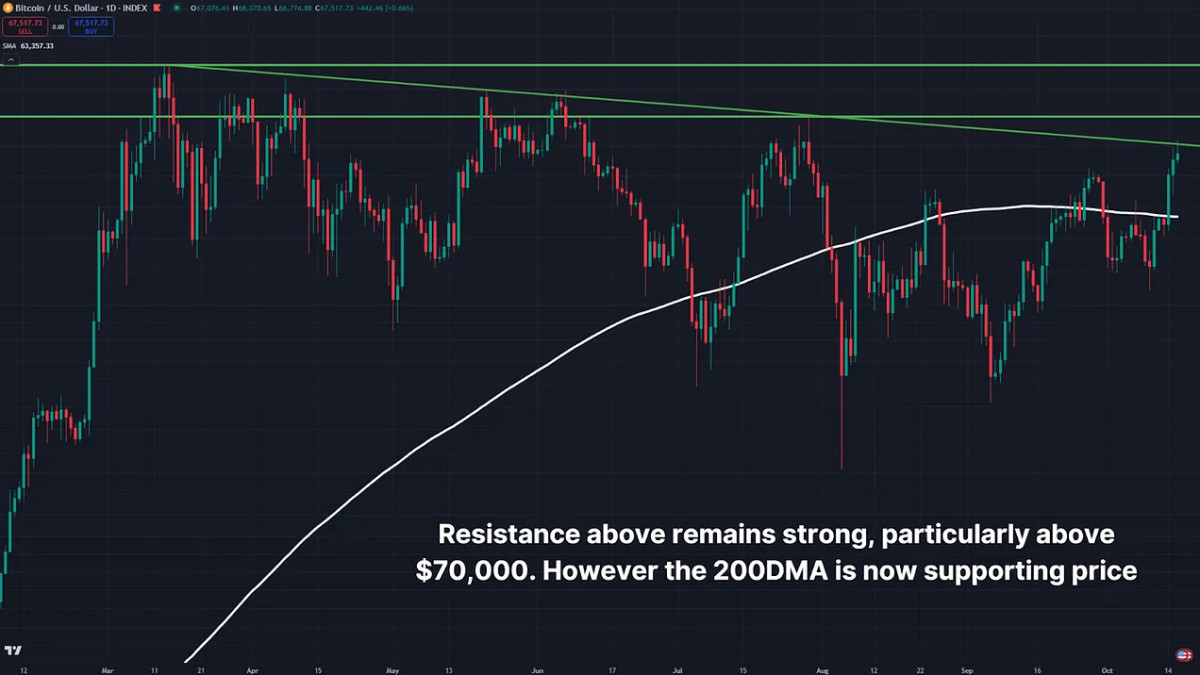
One positive technical element is the recent reclaim of the 200 daily moving average. A key level for investors to watch that had acted as resistance for BTC over the previous few months.
The Macro Environment: Institutional and ETF Inflows
Beyond technical indicators, the macro environment is increasingly favorable for Bitcoin. Institutional money continues to flow into Bitcoin Exchange-Traded Funds (ETFs). In the past few days, over $1 billion has flowed into Bitcoin ETFs, reflecting growing confidence in the asset. Over the past few weeks, we’ve seen hundreds of millions more in ETF inflows, signaling that smart money, particularly institutional investors, is bullish on Bitcoin’s future.
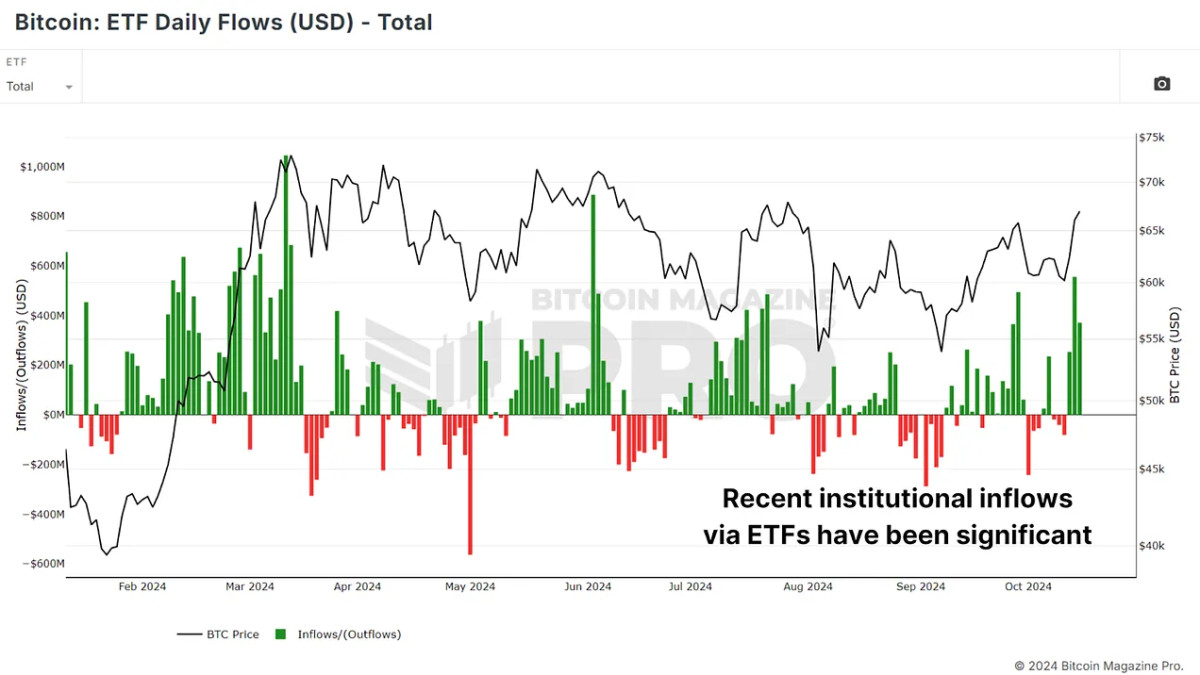
This is significant because institutional money tends to take a long-term view, providing a more stable base of support than retail speculation. Moreover, as equities and even gold have been gaining ground in recent months, Bitcoin appears to be lagging slightly behind. This could set the stage for Bitcoin to play catch-up, particularly if investors rotate from traditional assets into the more risk-on realm of Bitcoin.
Conclusion
Bitcoin’s price action, funding rates, and sentiment all suggest that the market is in a healthier place than it has been in months. Institutional inflows into ETFs and improving macro conditions add further bullish tailwinds. However, significant resistance lies ahead, and any rally will likely face challenges before Bitcoin can truly break out to new highs.
For a more in-depth look into this topic, check out a recent YouTube video here:
Can Bitcoin Now Make A New ATH
Credit: Source link