Close Menu
  • Home
  • Crypto News
  • Bitcoin
  • Ethereum
  • Ripple
  • Altcoins
  • Blockchain
  • Regulations
  • Trading
What's Hot

How MSCI Shifted From Objective Benchmark To Defacto Market Regulator

September 16, 2026

Bitcoin Stays Stuck as Traders Wait for the Fed’s Next Move

September 16, 2026

Ethereum risks 10% drop against Bitcoin as double-top pattern emerges

September 16, 2026
Facebook X (Twitter) Instagram
ethcred.com
  • Home
  • Crypto News
  • Bitcoin
  • Ethereum
  • Ripple
  • Altcoins
  • Blockchain
  • Regulations
  • Trading
ethcred.com
Home » Short-term holders show signs of seller exhaustion
Altcoins

Short-term holders show signs of seller exhaustion

September 19, 2023No Comments3 Mins Read
Facebook Twitter LinkedIn Tumblr Email Reddit VKontakte Telegram WhatsApp
Short-term holders show signs of seller exhaustion
Share
Facebook Twitter LinkedIn Pinterest Email

Monitoring unrealized profit and loss is a cornerstone of market analysis. While realized profit and loss offer a snapshot of the market’s past behavior, unrealized profit, and loss provide a window into the market’s potential trajectory. This distinction becomes even more pronounced when we zero in on short-term holders.

Short-term holders, defined as entities holding Bitcoin (BTC) for less than 155 days, play a pivotal role in shaping the market dynamics. Their behavior, driven by recent market trends and short-term goals, profoundly influences Bitcoin’s price. Conversely, price movements can also sway their decisions, creating a feedback loop that stabilizes or destabilizes the market.

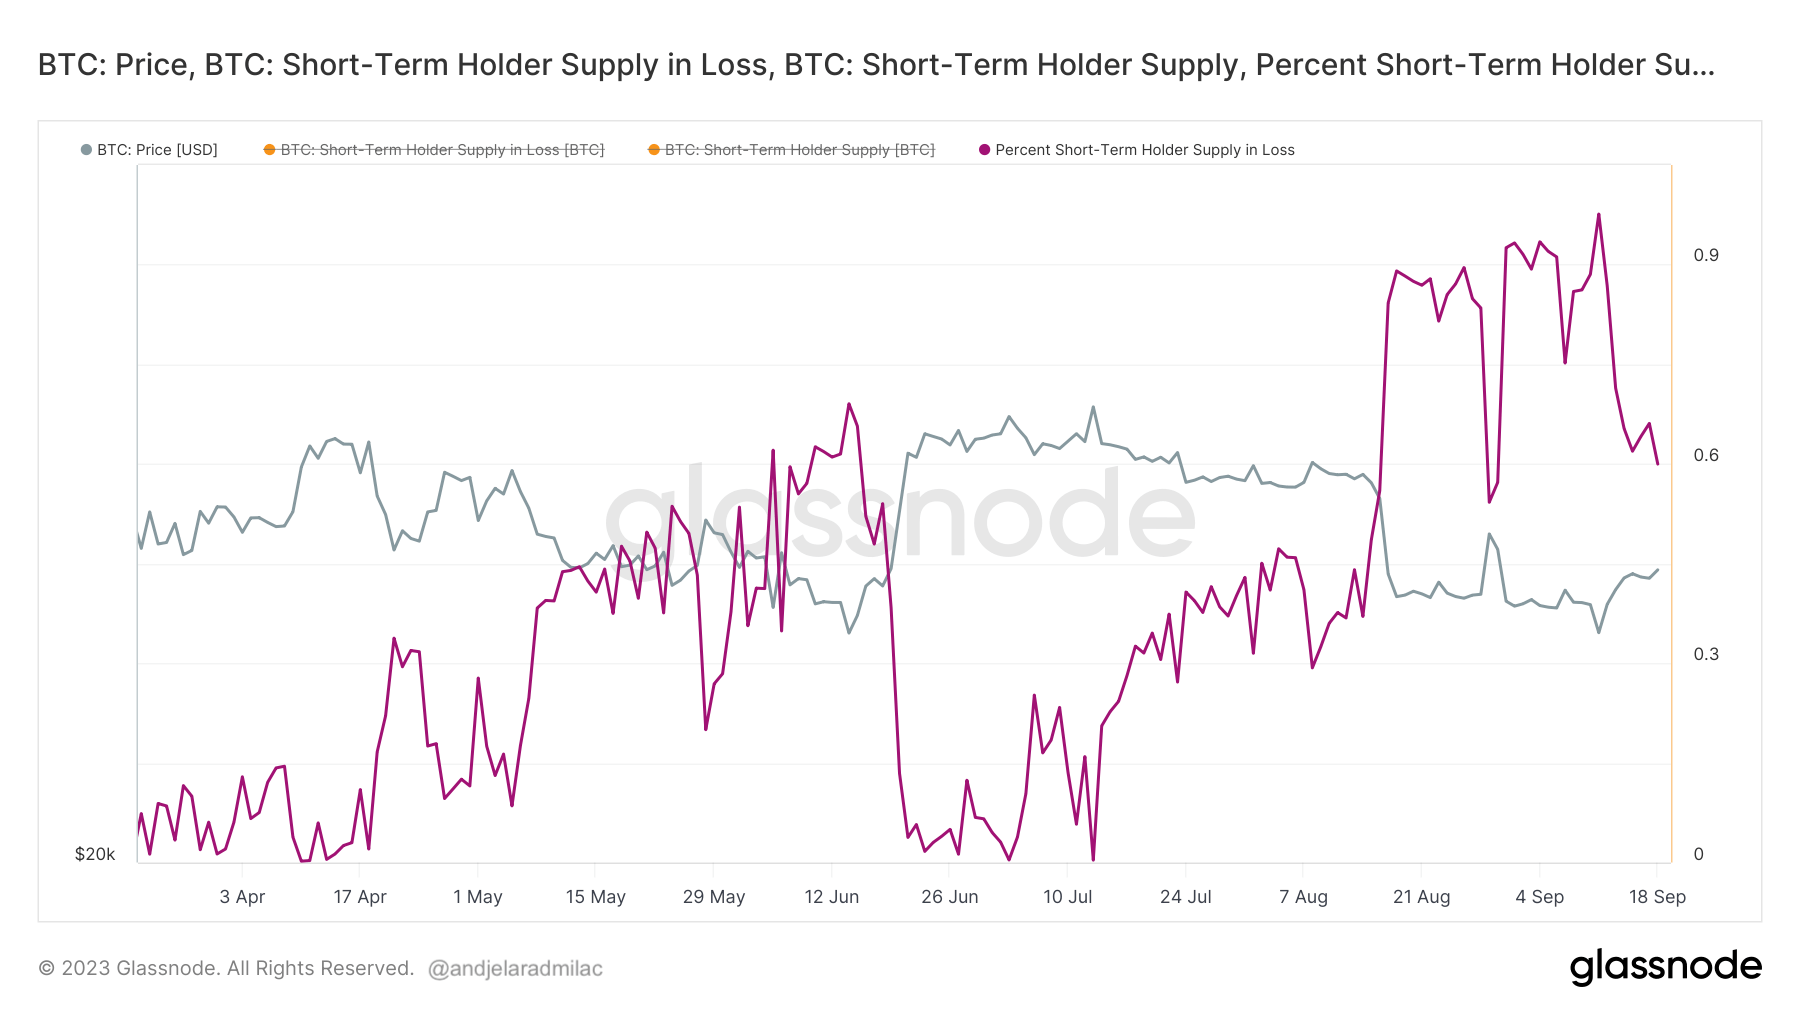
Recent data from Glassnode sheds light on the state of short-term holders. Following Bitcoin’s brief dip to $25,000 on Sep. 11, the percentage of short-term holder supply in loss rose to 97.61%. Bitcoin’s recovery to $27,000 reduced the supply loss to 59%. On Sep. 19.

Graph showing the percent of short-term holder supply in loss from March 22 to Sep. 19, 2023 (Source: Glassnode)

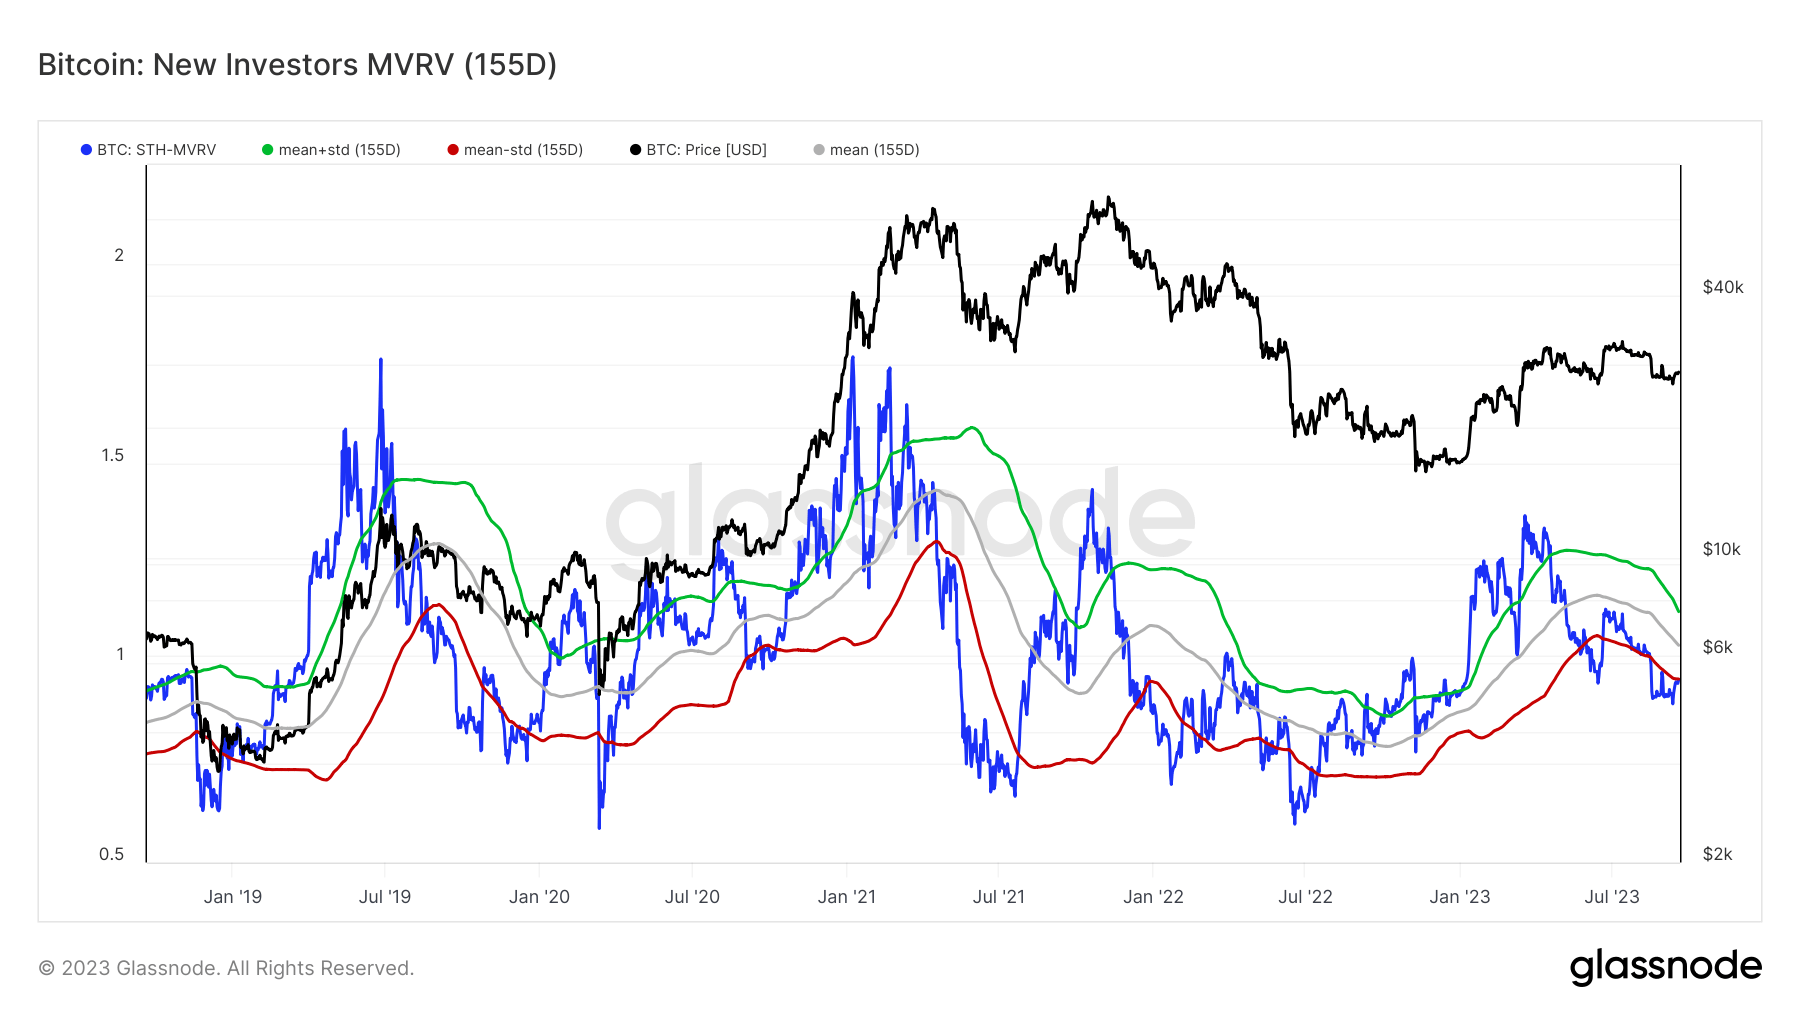
The MVRV ratio shows short-term holders’ unrealized profit or loss relative to the asset’s market value.

By juxtaposing the extremes in STH-MVRV against its 155-day average, we can create upper and lower bands for the indicator. The upper band represents the mean plus one standard deviation, while the lower band is the mean minus one standard deviation.

These bands show that many of the market’s highs and lows correlated with significant deviations outside these boundaries. This indicates that recent investors were either reaping substantial profits or nursing significant losses during these periods.
short-term holders mvrv ratio 5y bitcoin
Graph showing the STH-MVRV ratio from Sep. 2018 to Sep. 2023. Note that market tops and market bottoms correlate with extreme deviations of the STH-MVRV ratio (Source: Glassnode)

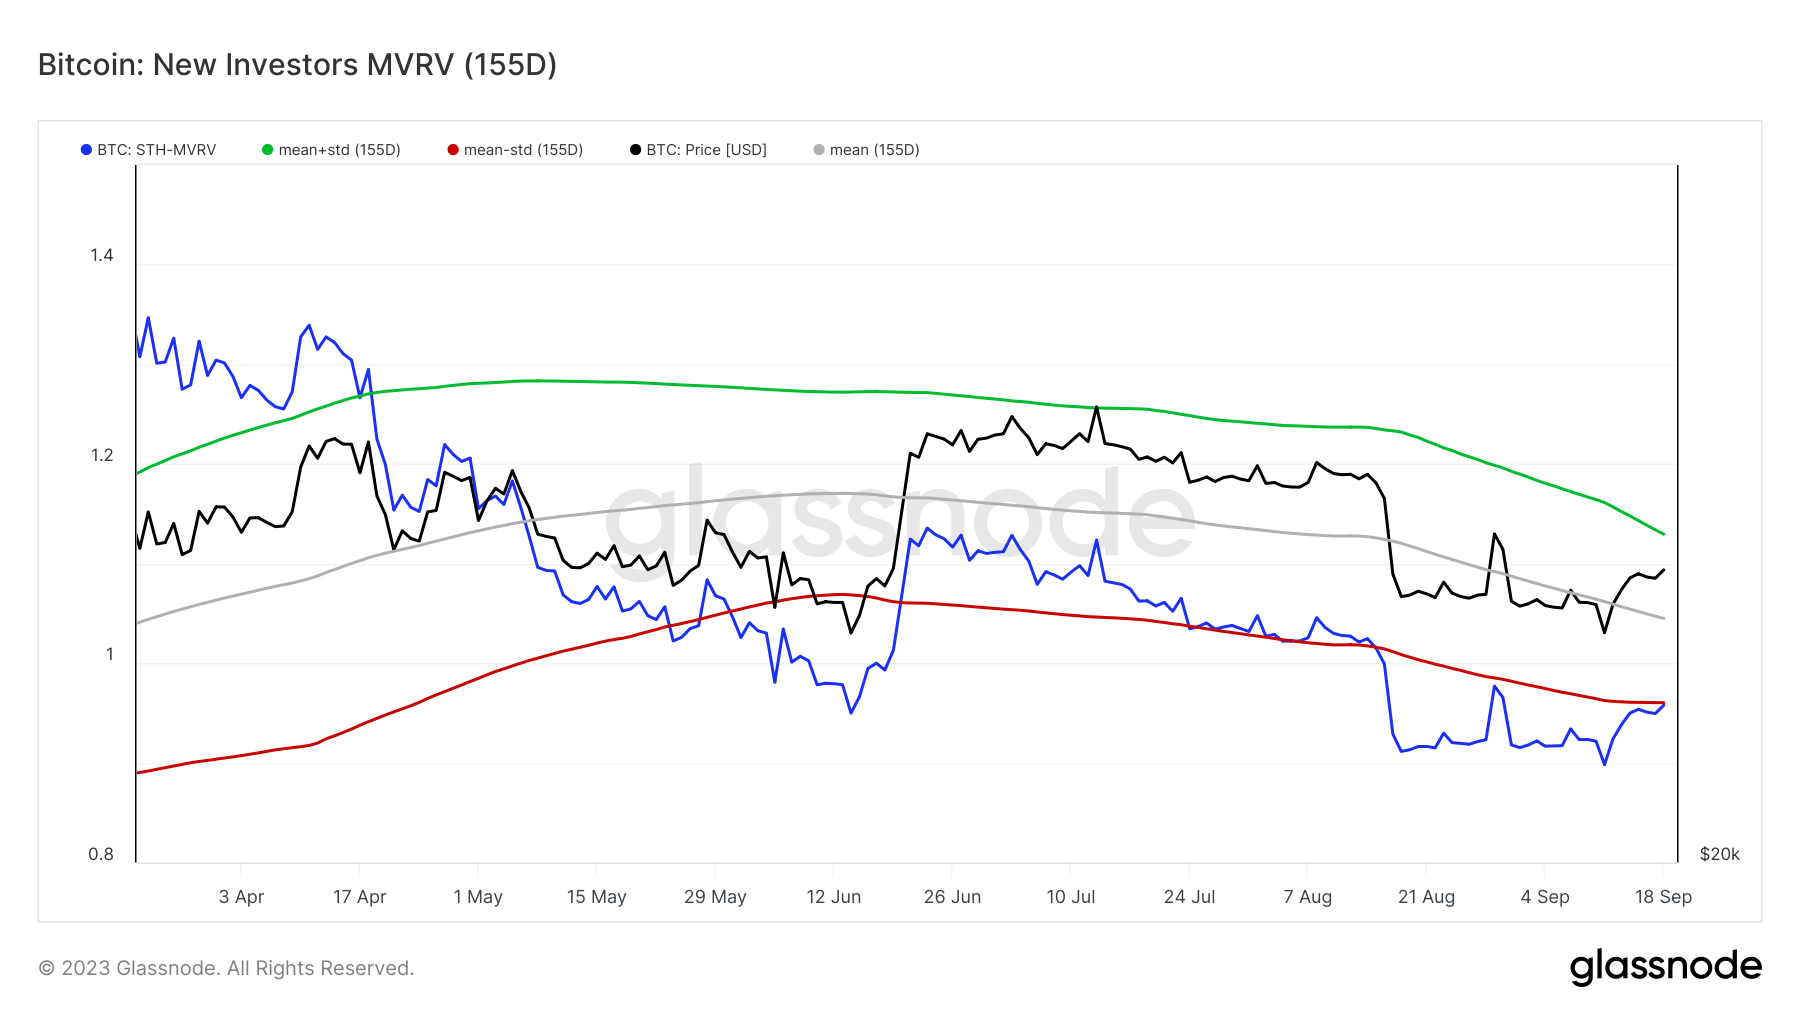
As of Sep. 11, the STH-MVRV ratio hovers at 0.95, brushing against the lower band. It’s worth noting that the STH-MVRV dipped below this lower threshold on Aug. 15, coinciding with Bitcoin’s price slide from $29,000 to $26,000. The ratio has remained below this band since then.
short-term holders mvrv ratio 6mo
Graph showing the STH-MVRV ratio from March 22 to Sep. 22, 2023 (Source: Glassnode)

The current position of the STH-MVRV ratio, coupled with the percentage of short-term holder supply in loss, suggests a heightened state of seller exhaustion. In the context of Bitcoin’s price, seller exhaustion implies that the selling pressure starts to wane as most short-term holders who want to sell have already done so. Historically, such scenarios have often paved the way for price recoveries as selling pressures diminish.

The post Short-term holders show signs of seller exhaustion appeared first on CryptoSlate.

Credit: Source link

Share. Facebook Twitter Pinterest LinkedIn Tumblr Email Reddit VKontakte Telegram WhatsApp

Related Posts

Shiba Inu Crashes 10%, Falls Below $0.000005: What Next?

September 16, 2026

Could XRP Price Be About to Repeat a Historic Rally?

September 15, 2026

AI Predicts SHIB’s Price for December 1, 2024

November 27, 2024

Shiba Inu To Surge 75% Above 2024 Highs, Analyst Confirms

November 26, 2024
Add A Comment

Comments are closed.

What's New Here!

How MSCI Shifted From Objective Benchmark To Defacto Market Regulator

September 16, 2026

Bitcoin Stays Stuck as Traders Wait for the Fed’s Next Move

September 16, 2026

Ethereum risks 10% drop against Bitcoin as double-top pattern emerges

September 16, 2026

Shiba Inu Crashes 10%, Falls Below $0.000005: What Next?

September 16, 2026

XRP gains nearly 30% as Ripple ramps up a surprising college sports push

September 16, 2026
Facebook X (Twitter) Instagram Pinterest
  • Contact Us
  • Disclaimer
  • Privacy Policy
  • Terms of Use
  • DMCA
© 2026 - ethcred.com - All Rights Reserved!

Type above and press Enter to search. Press Esc to cancel.