
Polkadot (DOT) has continued its upward trajectory as it inches towards a critical resistance level at $5. A breakout above this level could spark a major rally for the cryptocurrency, which has been in a downward trend for almost six months.
Analysts believe DOT is on the verge of a breakout after several indicators, such as the formation of a falling wedge pattern and bullish divergence on several indicators, suggesting a possible rally.
The Polkadot (DOT) Price Chart
Looking at the Polkadot (DOT) price chart, we can see that DOT has been quite bullish all week after ending the weekend in the red. Monday saw DOT register a sharp jump of 3.48%, which allowed it to go above the 50-day SMA and settle at $4.46. Bullish momentum persisted on Tuesday as DOT rose by just over 4% to go past the crucial $4.50 level, a level it struggled to surpass, and settle at $4.64. Volatility increased on Wednesday as sellers attempted to drive DOT back below $4.50. However, buyers could counter the selling pressure, ensuring DOT remained at $4.64. With overall market sentiment turning positive on Thursday, DOT rallied as well, registering an increase of almost 4%t to move within striking distance of $5 at $4.81.
Source: TradingView
The current session sees DOT up by 1.46% and trading around the $4.90 level. Buyers have already tested the $5 level once, as seen in the chart, but sellers are holding on for now. DOT’s MACD and RSI are also bullish, as seen in the price chart, further lending credibility to the possibility of a breakout above $5.
Looking Under The Hood
Let’s examine some key indicators to understand DOT’s price movements. If we consider the bigger picture and study DOT’s chart, we will see that it reveals a falling wedge pattern. Currently, DOT is interacting with a critical resistance level at $5, which is also the descending trendline. Additionally, several other indicators point to a breakout.
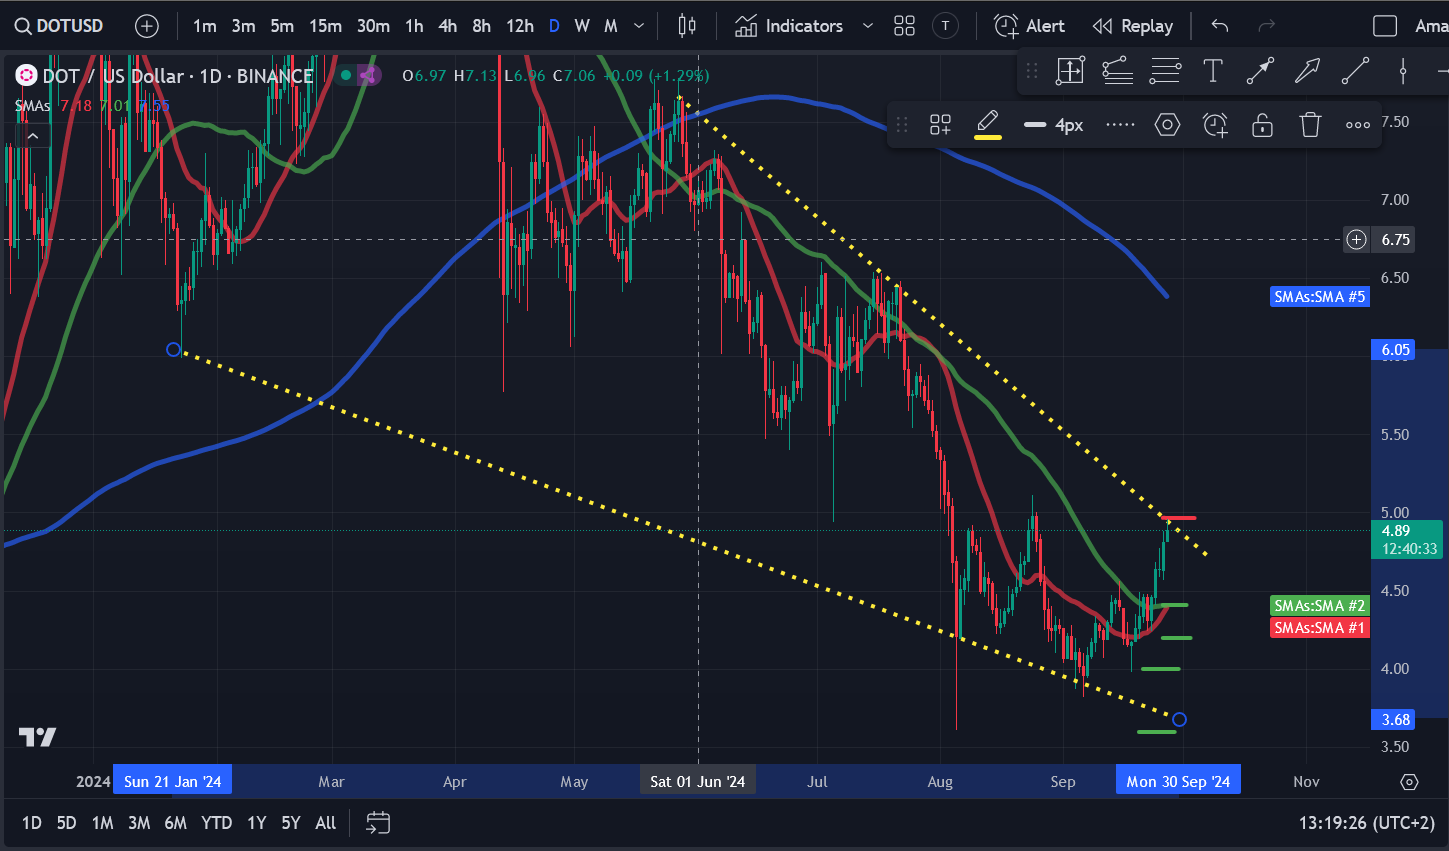
DOT’s falling wedge pattern: TradingView
Another analyst, Scott Melker, pointed out that while a breakout is not confirmed, but also highlighted the presence of a bullish divergence between the price and the RSI. DOT’s price has made lower lows, while the RSI has made higher lows, an indicator that the downward trend could be on its last legs.
A Key Moment For Polkadot (DOT)
Polkadot (DOT) is on the cusp of a critical moment as it approaches $5. A decisive break above $5 will signal a reversal in the bearish trend and present buyers with a rare buying opportunity. However, unless such a break does not materialize, analysts have urged investors to adopt a wait-and-watch approach. If DOT does go past $5, it will look to reclaim $6 and $6.50. On the other hand, if bulls lose momentum, a drop back below $4.50 can be expected.
Disclaimer: This article is provided for informational purposes only. It is not offered or intended to be used as legal, tax, investment, financial, or other advice.
Investment Disclaimer
Credit: Source link