After reaching new all-time highs earlier this year, Bitcoin has entered a multi-month period of choppy price action, leading many to wonder if the bull cycle is over. In this article, we dive deep into key metrics and trends to understand if the market is just cooling off or if we’ve already seen the peak for this cycle.
Fundamentally Overvalued?
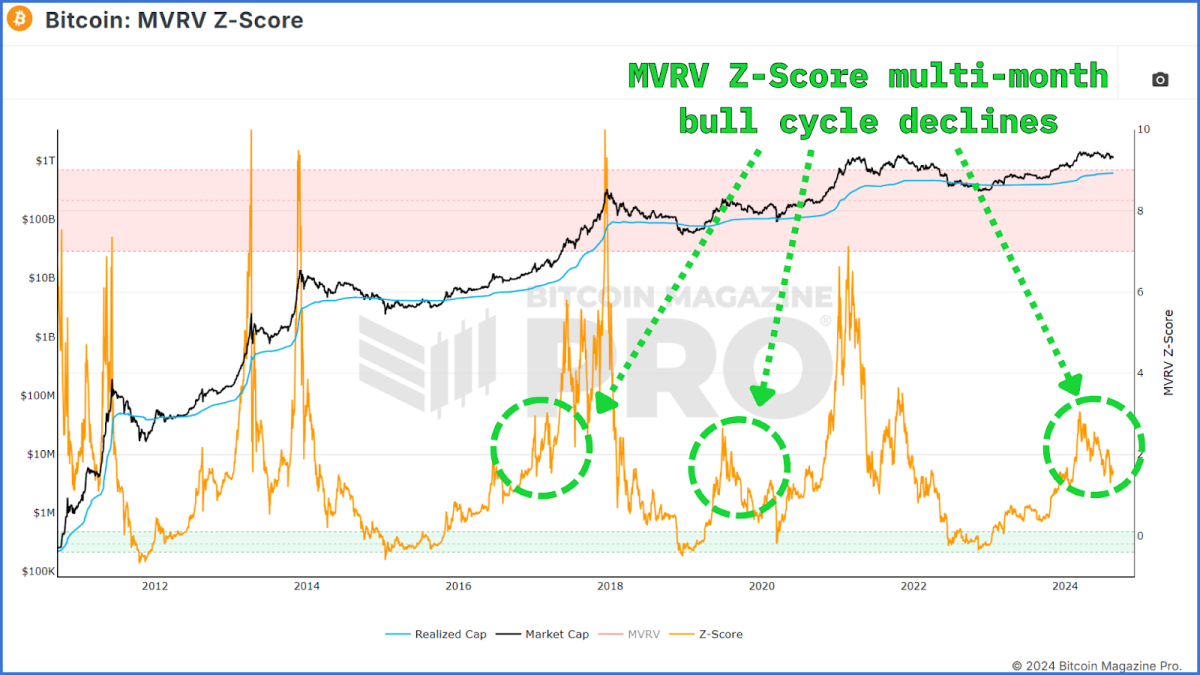
One of the most reliable tools for gauging Bitcoin’s market cycles is the MVRV Z-Score. This metric measures the difference between Bitcoin’s market cap and its realized cap, or cost-basis for all circulating BTC, helping investors determine whether Bitcoin is over or undervalued according to this ‘fundamental’ cost of BTC.
Recent data shows that the MVRV Z-Score has demonstrated a sustained downward movement, which might suggest that Bitcoin’s upward trajectory has ended. However, a historical analysis tells a different story. During previous bull cycles, including those in 2016-2017 and 2019-2020, similar declines in the MVRV Z-Score were observed. These drawdown periods were followed by significant rallies, leading to new all-time highs. Thus, while the current downtrend may seem concerning, it’s not necessarily indicative of the bull cycle being over.
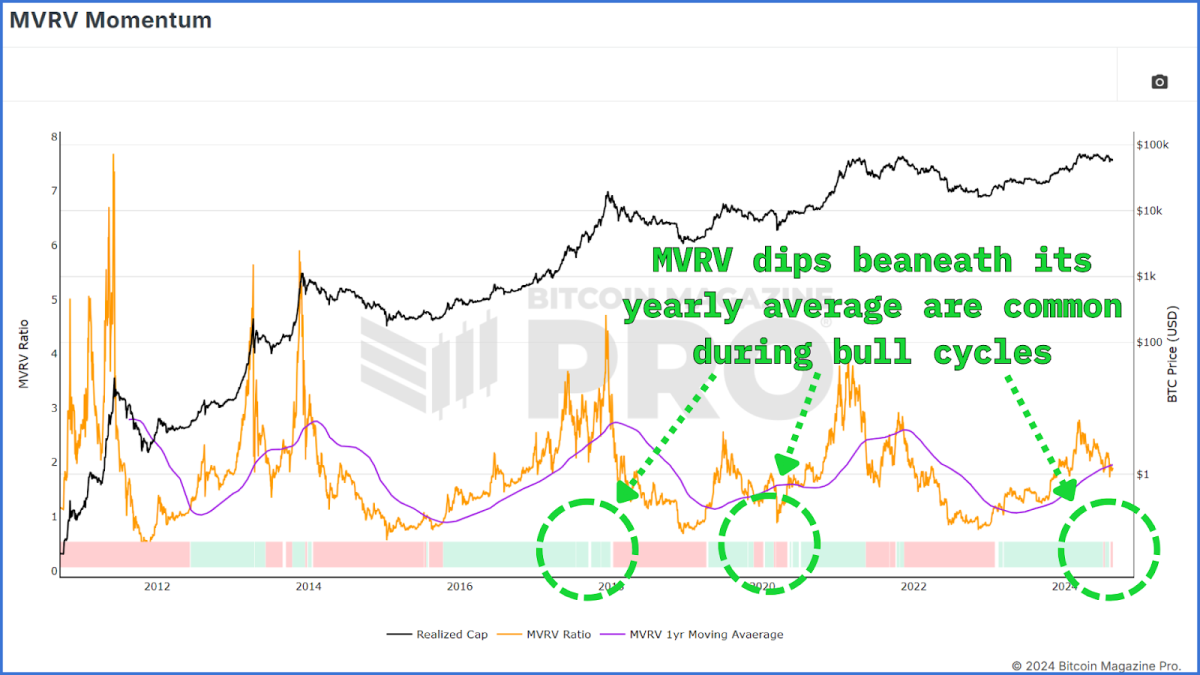
The MVRV Momentum Indicator helps distinguish between bull and bear cycles by applying a moving average to the raw MVRV data. It recently dipped below its moving average and turned red, which may signal the start of a bear cycle. However, historical data shows that similar dips have occurred without leading to a prolonged bear market.
Struggling Beneath Resistance?
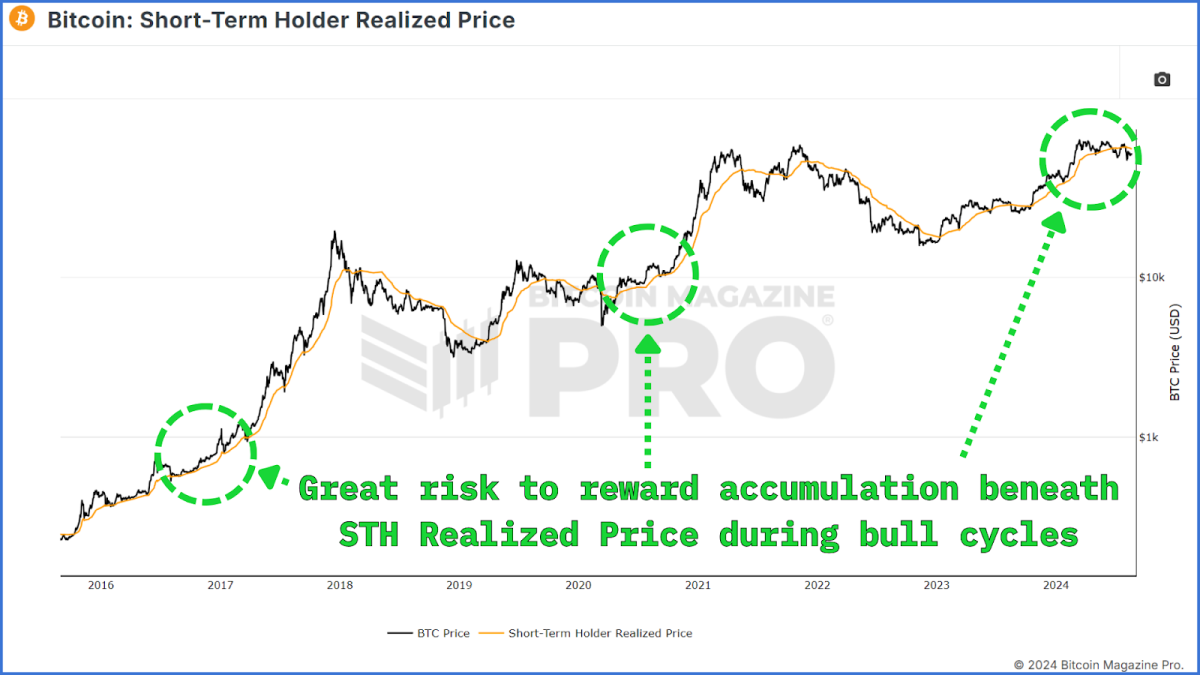
Another essential metric to consider is the Short-Term Holder (STH) Realized Price, which represents the average price at which recent market participants acquired their Bitcoin. Currently, the STH Realized Price is around $63,000, slightly above the current market price. This means that many new investors are holding Bitcoin at a loss.
However, during previous bull cycles, Bitcoin’s price dipped below the STH Realized Price multiple times without signaling the end of the bull market. These dips often presented opportunities for investors to accumulate Bitcoin at discounted prices before the next leg up.
Investor Capitulation?
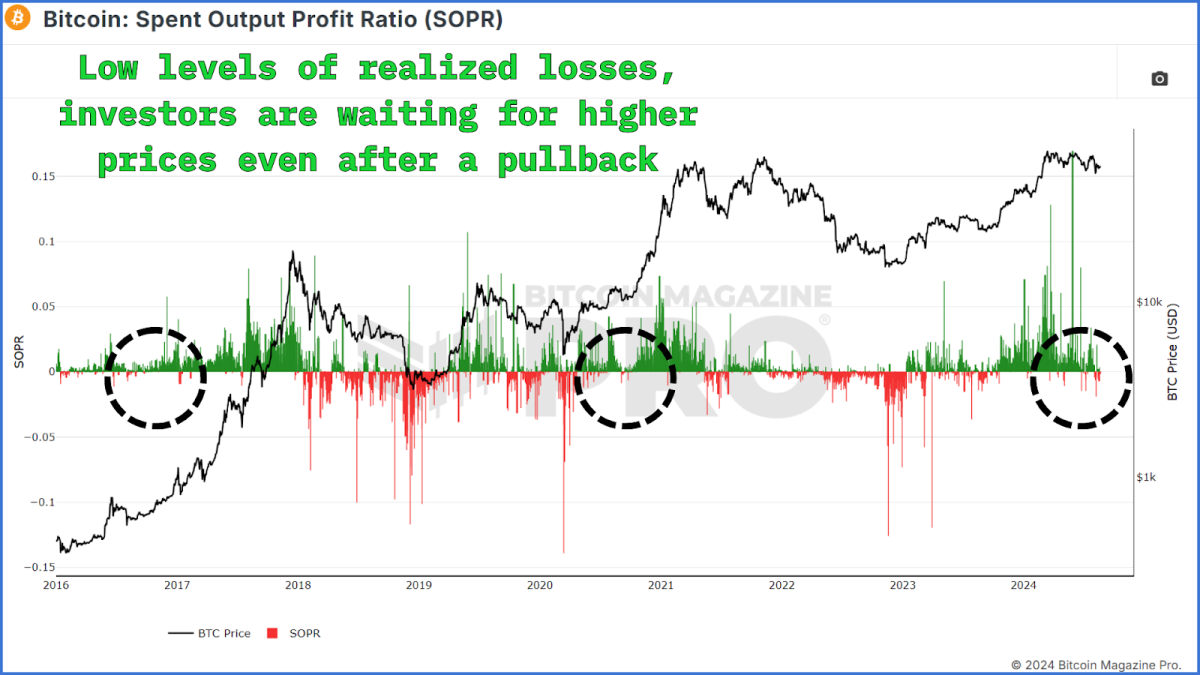
The Spent Output Profit Ratio (SOPR) assesses whether Bitcoin holders are selling at a profit or a loss. When the SOPR is below 0, it suggests that more holders are selling at a loss, which can signal market capitulation. However, recent SOPR data shows only a few instances of selling at a loss, which have been brief. This implies that there is no widespread panic among Bitcoin holders, typically seen during a bear market’s early stages.
In the past, brief periods of selling at a loss during a bull cycle have been followed by significant price increases, as seen in the 2020-2021 run-up. Therefore, the lack of sustained losses and capitulation in the SOPR data supports the view that the bull cycle is still intact.
Diminishing Returns?
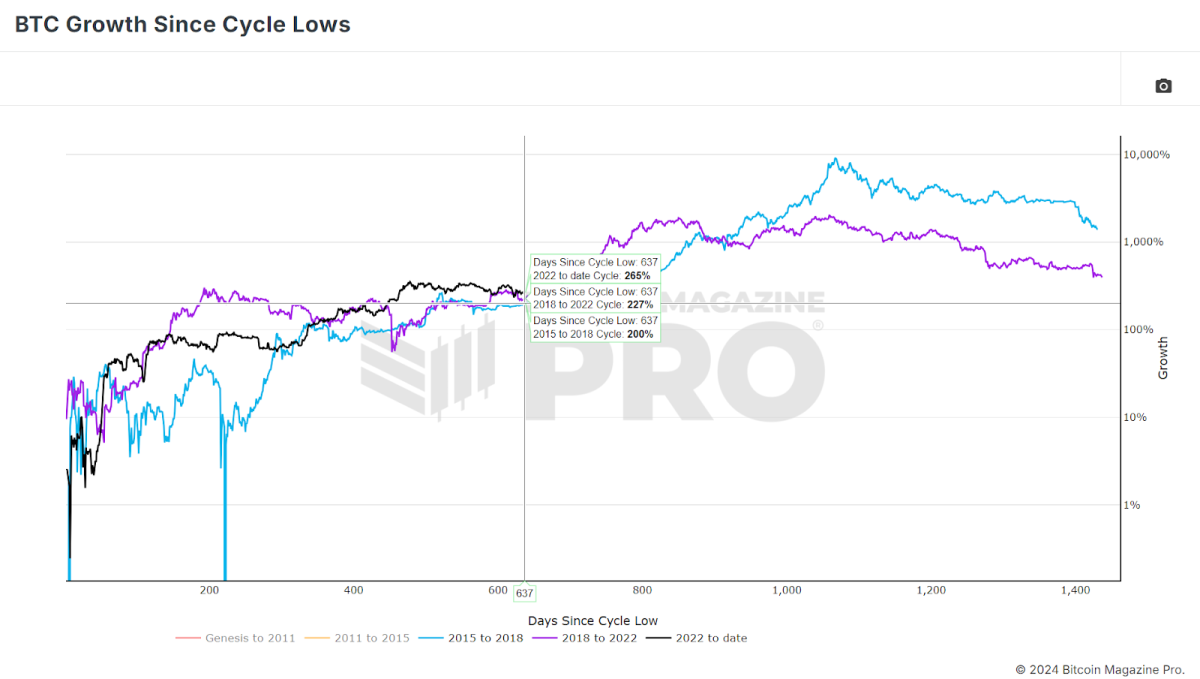
There’s a theory that each Bitcoin cycle has diminishing returns, with lower percentage gains than the previous cycle. If we compare the current cycle to previous ones, it’s clear that Bitcoin has already outperformed both the 2015-2018 and 2018-2022 cycles regarding percentage gains. This outperformance might suggest that Bitcoin has gotten ahead of itself, necessitating a cooling-off period.
However, it’s also important to remember that this cooling-off period doesn’t mean the end of the bull market. Historically, Bitcoin has experienced similar pauses before resuming its upward trajectory. Thus, while we might see more sideways or even downward price action in the short term, this doesn’t necessarily indicate that the bull market is over.
The Hash Ribbons Buy Signal
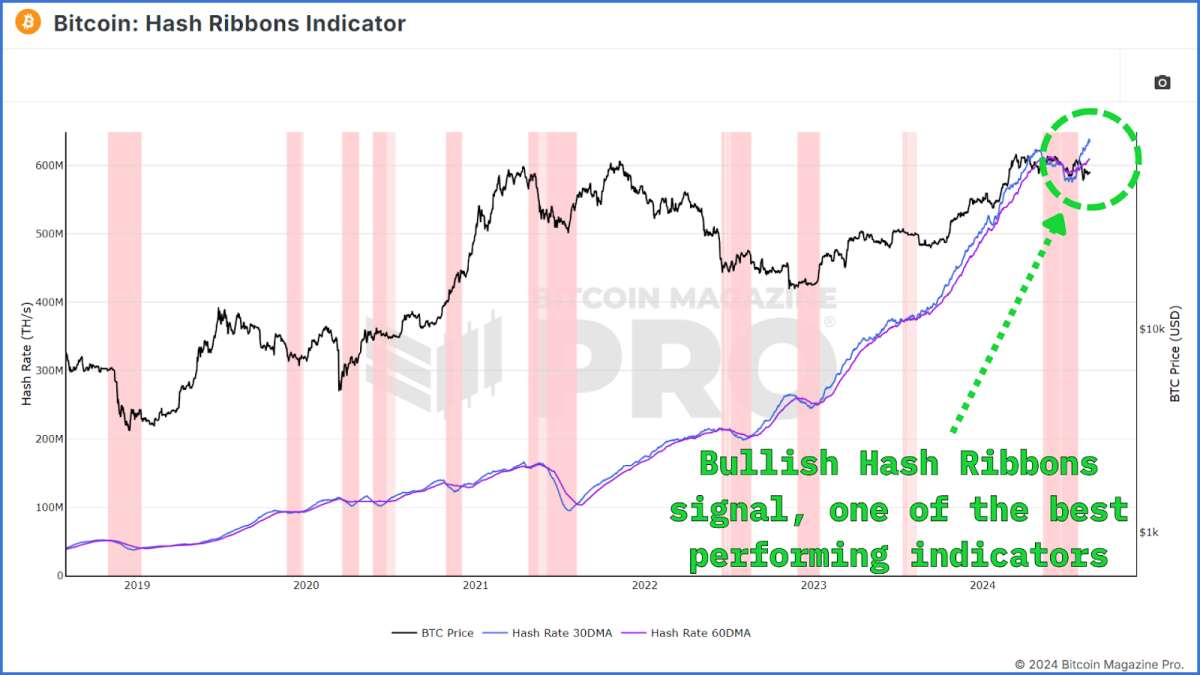
One of the most promising indicators for Bitcoin’s future price action is the Hash Ribbons Buy Signal. This signal occurs when the 30-day moving average of Bitcoin’s hash rate crosses above the 60-day moving average, indicating that miners are recovering after a period of capitulation. The Hash Ribbons Buy Signal has historically been a reliable indicator of bullish price action in the months that follow.
Recently, Bitcoin has shown this buy signal for the first time since the halving event earlier this year, suggesting that Bitcoin could see positive price action in the coming weeks and months.
Conclusion
In summary, while there are signs of weakness in the Bitcoin market, such as the dip in the MVRV Z-Score and the STH Realized Price, these metrics have shown similar behavior in previous bull cycles without signaling the end of the market. The lack of widespread capitulation, as indicated by the SOPR and the recent Hash Ribbons Buy Signal, provides further confidence that the bull cycle is still intact.
For a more in-depth look into this topic, check out a recent YouTube video here:
Credit: Source link