Close Menu
  • Home
  • Crypto News
  • Bitcoin
  • Ethereum
  • Ripple
  • Altcoins
  • Blockchain
  • Regulations
  • Trading
What's Hot

How MSCI Shifted From Objective Benchmark To Defacto Market Regulator

September 16, 2026

Bitcoin Stays Stuck as Traders Wait for the Fed’s Next Move

September 16, 2026

Ethereum risks 10% drop against Bitcoin as double-top pattern emerges

September 16, 2026
Facebook X (Twitter) Instagram
ethcred.com
  • Home
  • Crypto News
  • Bitcoin
  • Ethereum
  • Ripple
  • Altcoins
  • Blockchain
  • Regulations
  • Trading
ethcred.com
Home » Huobi seeing increased outflows to competitors according to new reliance metrics
Altcoins

Huobi seeing increased outflows to competitors according to new reliance metrics

August 30, 2023No Comments3 Mins Read
Facebook Twitter LinkedIn Tumblr Email Reddit VKontakte Telegram WhatsApp
Huobi seeing increased outflows to competitors according to new reliance metrics
Share
Facebook Twitter LinkedIn Pinterest Email

The downfall of FTX has underscored the counter-party risks that exchanges can impose on the market. As traders and investors tread with heightened caution, there’s an evident demand for reliable metrics to evaluate the health of these platforms.

Using the FTX data set as a benchmark, Glassnode has rolled out three innovative indicators designed to pinpoint high-risk scenarios among the major exchanges: Coinbase, Binance, Huobi, and the now-defunct FTX.

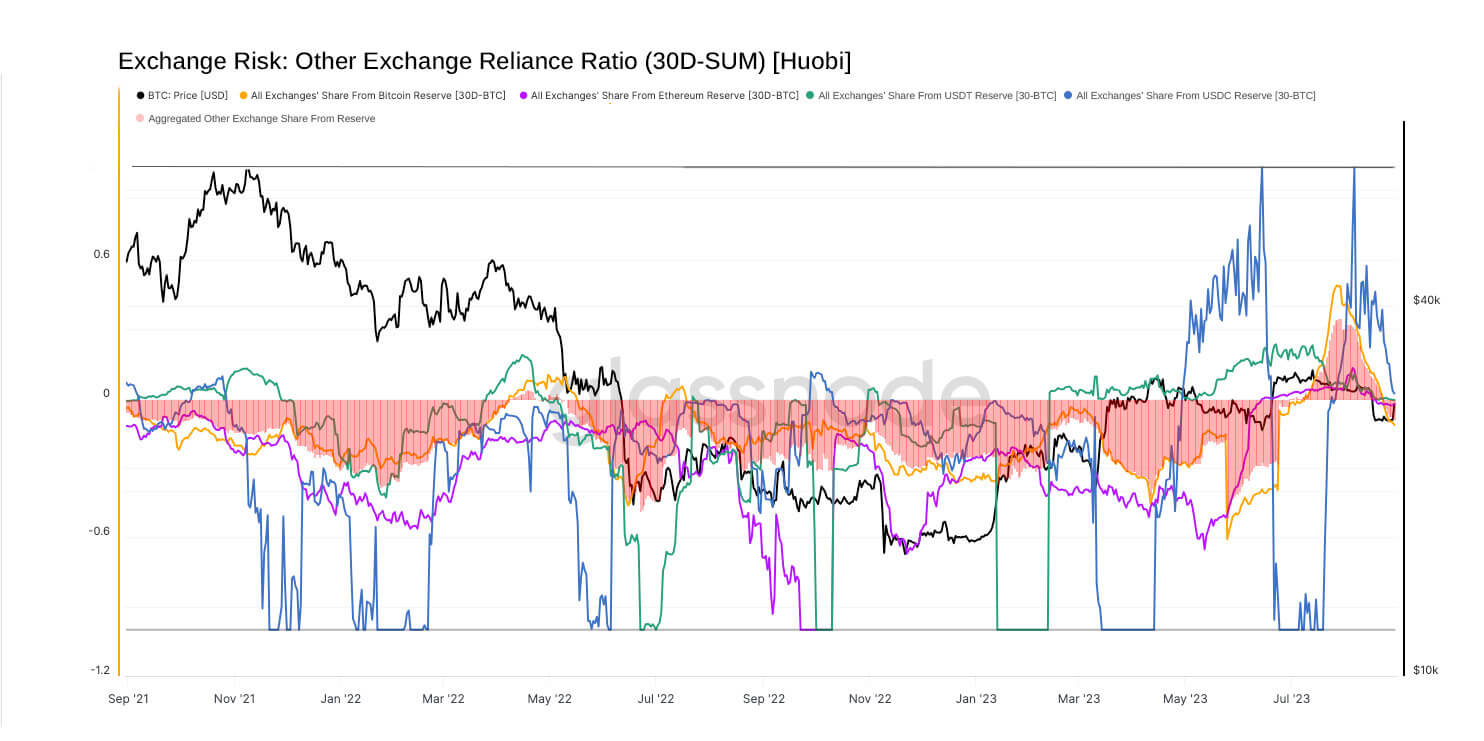
One of the indicators is the exchange reliance ratio, which shows when a significant portion of an exchange’s balance is regularly transferred to or from another exchange. A significant portion of an exchange’s balance being consistently moved to or from another platform might suggest a deep reliance or co-dependence on liquidity.

A positive ratio indicates net inflows to the exchange, while a negative one signifies net outflows. Prolonged periods of large negative values can be a red flag, indicating assets rapidly departing the exchange in favor of another platform.

While Binance and Coinbase exhibit a relatively low reliance ratio, indicating minor fund movements compared to their vast balances, Huobi’s data paints a different picture. Recent figures showed pronounced negative reliance ratios across all Huobi assets, indicating a marked increase in transfers from Huobi to other exchanges.

Graph showing the exchange reliance ratio from Huobi from Aug. 30, 2021, to Aug. 30, 2023.  (Source: Glassnode)

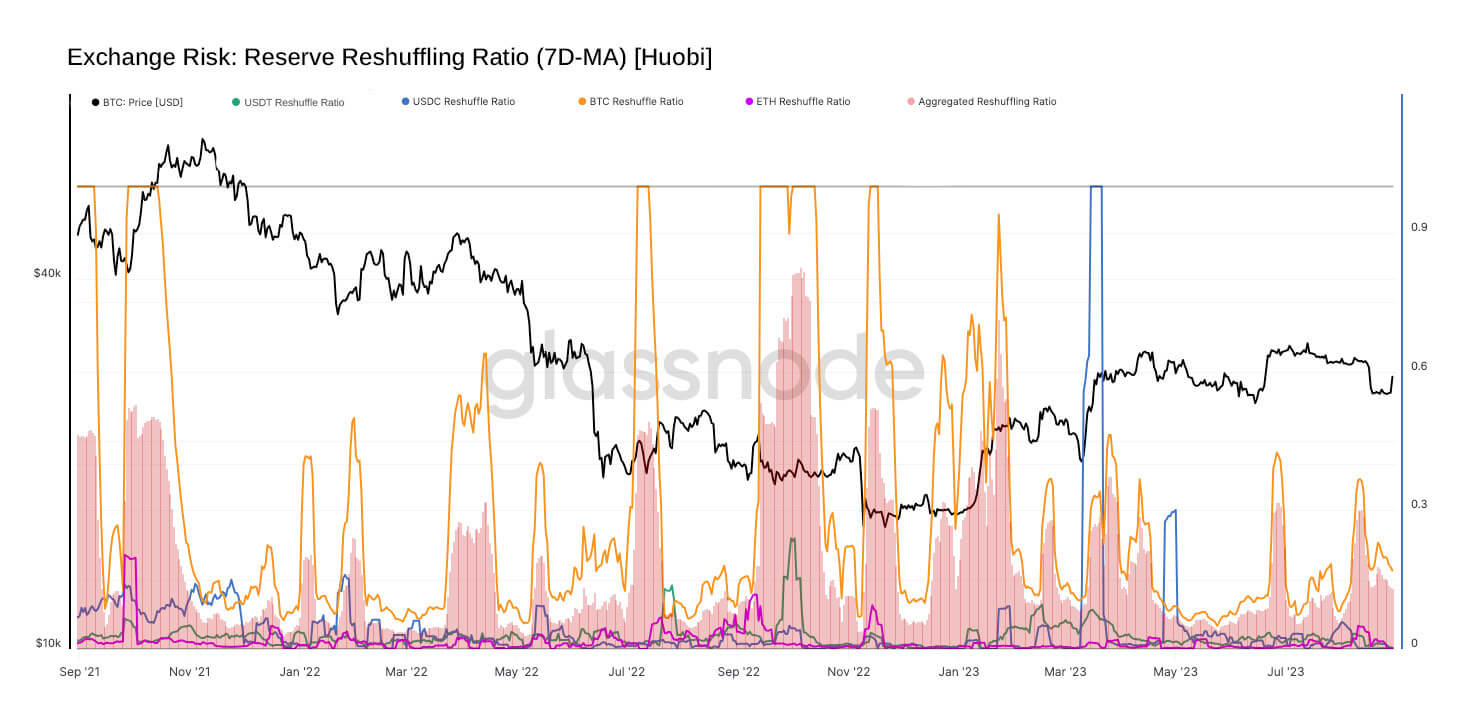
Huobi’s internal reshuffling ratio, which shows the proportion of an exchange’s balance transacted internally over a set period, mirrors that of Binance.
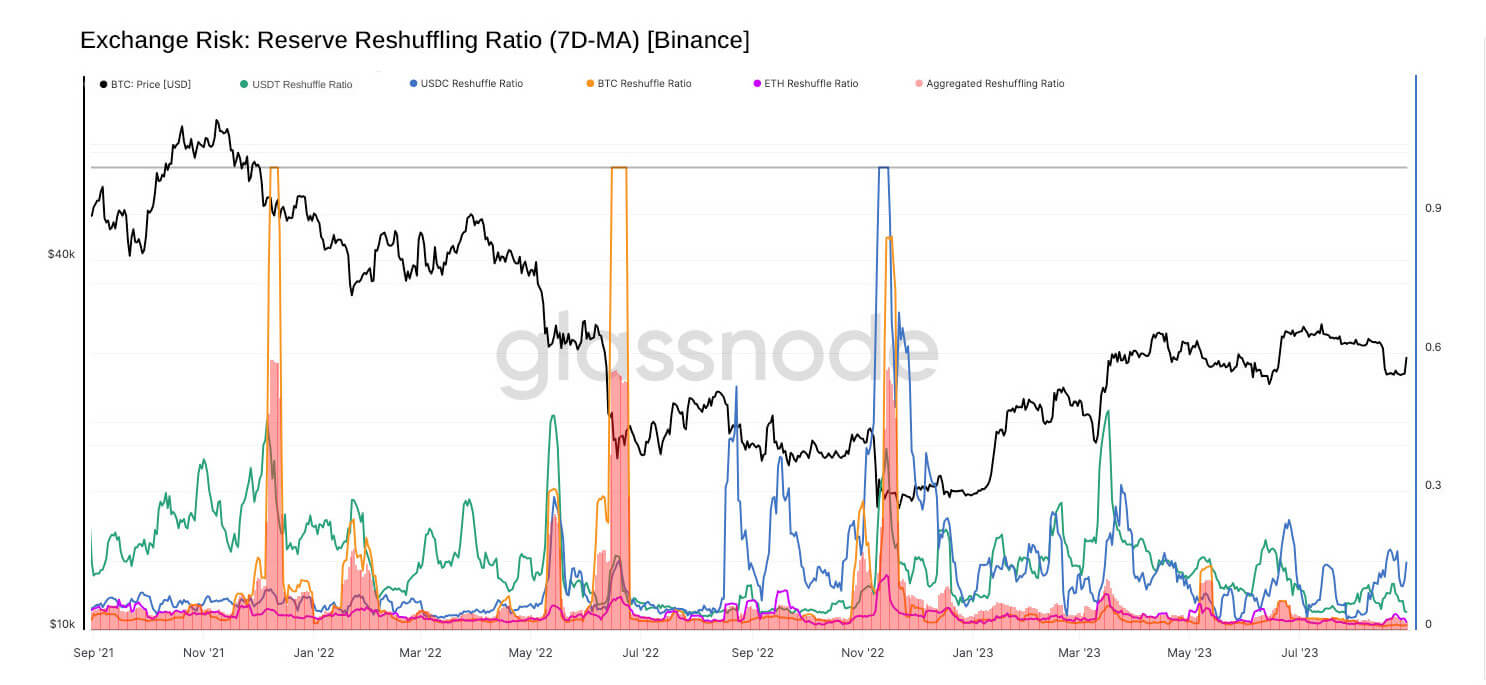
Binance's exchange reserve reshuffling ratio
Graph showing Binance’s exchange reserve reshuffling ratio from Aug.30, 2021, to Aug. 30, 2023 (Source: Glassnode)
Huobi's exchange reserve reshuffling ratio
Graph showing Huobi’s exchange reserve reshuffling ratio from Aug.30, 2021, to Aug. 30, 2023 (Source: Glassnode)

However, context is crucial here. Binance, the largest and most popular exchange on the market, dwarfs Huobi in every metric. Thus, the reshuffling spikes observed with Huobi could be magnified due to its depleting reserves.
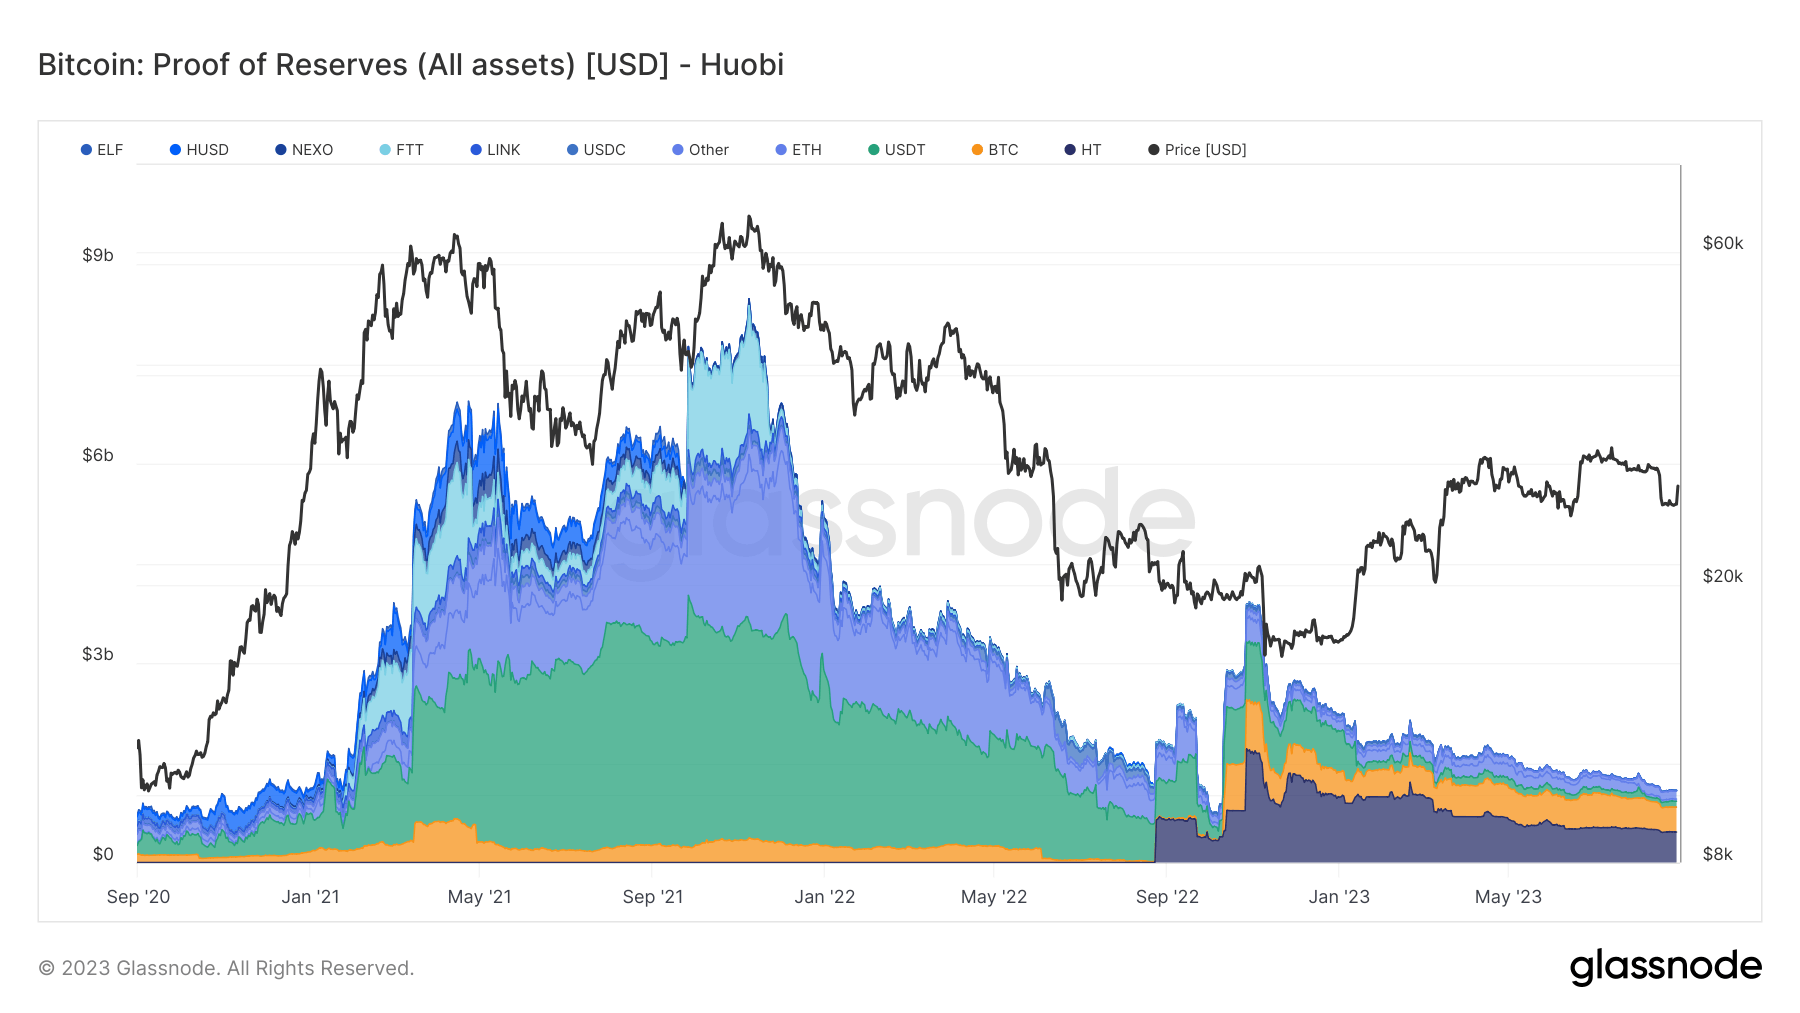
huobi proof of reserves 3y
Graph showing the total balance (in USD) of Huobi’s holdings from Aug. 2020 to Aug. 2023 (Source: Glassnode)

This connection between diminishing reserves and pronounced negative reliance ratios could be concerning. It suggests that assets are being moved internally with greater frequency and being transferred out of Huobi at a growing rate.

The correlation between Huobi’s dwindling reserves and its significant negative reliance ratios might indicate eroding confidence in the platform. While these metrics don’t definitively label an exchange as high-risk, the coming months will show if these indicators are passing anomalies or precursors to a more profound shift.

The post Huobi seeing increased outflows to competitors according to new reliance metrics appeared first on CryptoSlate.

Credit: Source link

Share. Facebook Twitter Pinterest LinkedIn Tumblr Email Reddit VKontakte Telegram WhatsApp

Related Posts

Shiba Inu Crashes 10%, Falls Below $0.000005: What Next?

September 16, 2026

Could XRP Price Be About to Repeat a Historic Rally?

September 15, 2026

AI Predicts SHIB’s Price for December 1, 2024

November 27, 2024

Shiba Inu To Surge 75% Above 2024 Highs, Analyst Confirms

November 26, 2024
Add A Comment

Comments are closed.

What's New Here!

How MSCI Shifted From Objective Benchmark To Defacto Market Regulator

September 16, 2026

Bitcoin Stays Stuck as Traders Wait for the Fed’s Next Move

September 16, 2026

Ethereum risks 10% drop against Bitcoin as double-top pattern emerges

September 16, 2026

Shiba Inu Crashes 10%, Falls Below $0.000005: What Next?

September 16, 2026

XRP gains nearly 30% as Ripple ramps up a surprising college sports push

September 16, 2026
Facebook X (Twitter) Instagram Pinterest
  • Contact Us
  • Disclaimer
  • Privacy Policy
  • Terms of Use
  • DMCA
© 2026 - ethcred.com - All Rights Reserved!

Type above and press Enter to search. Press Esc to cancel.