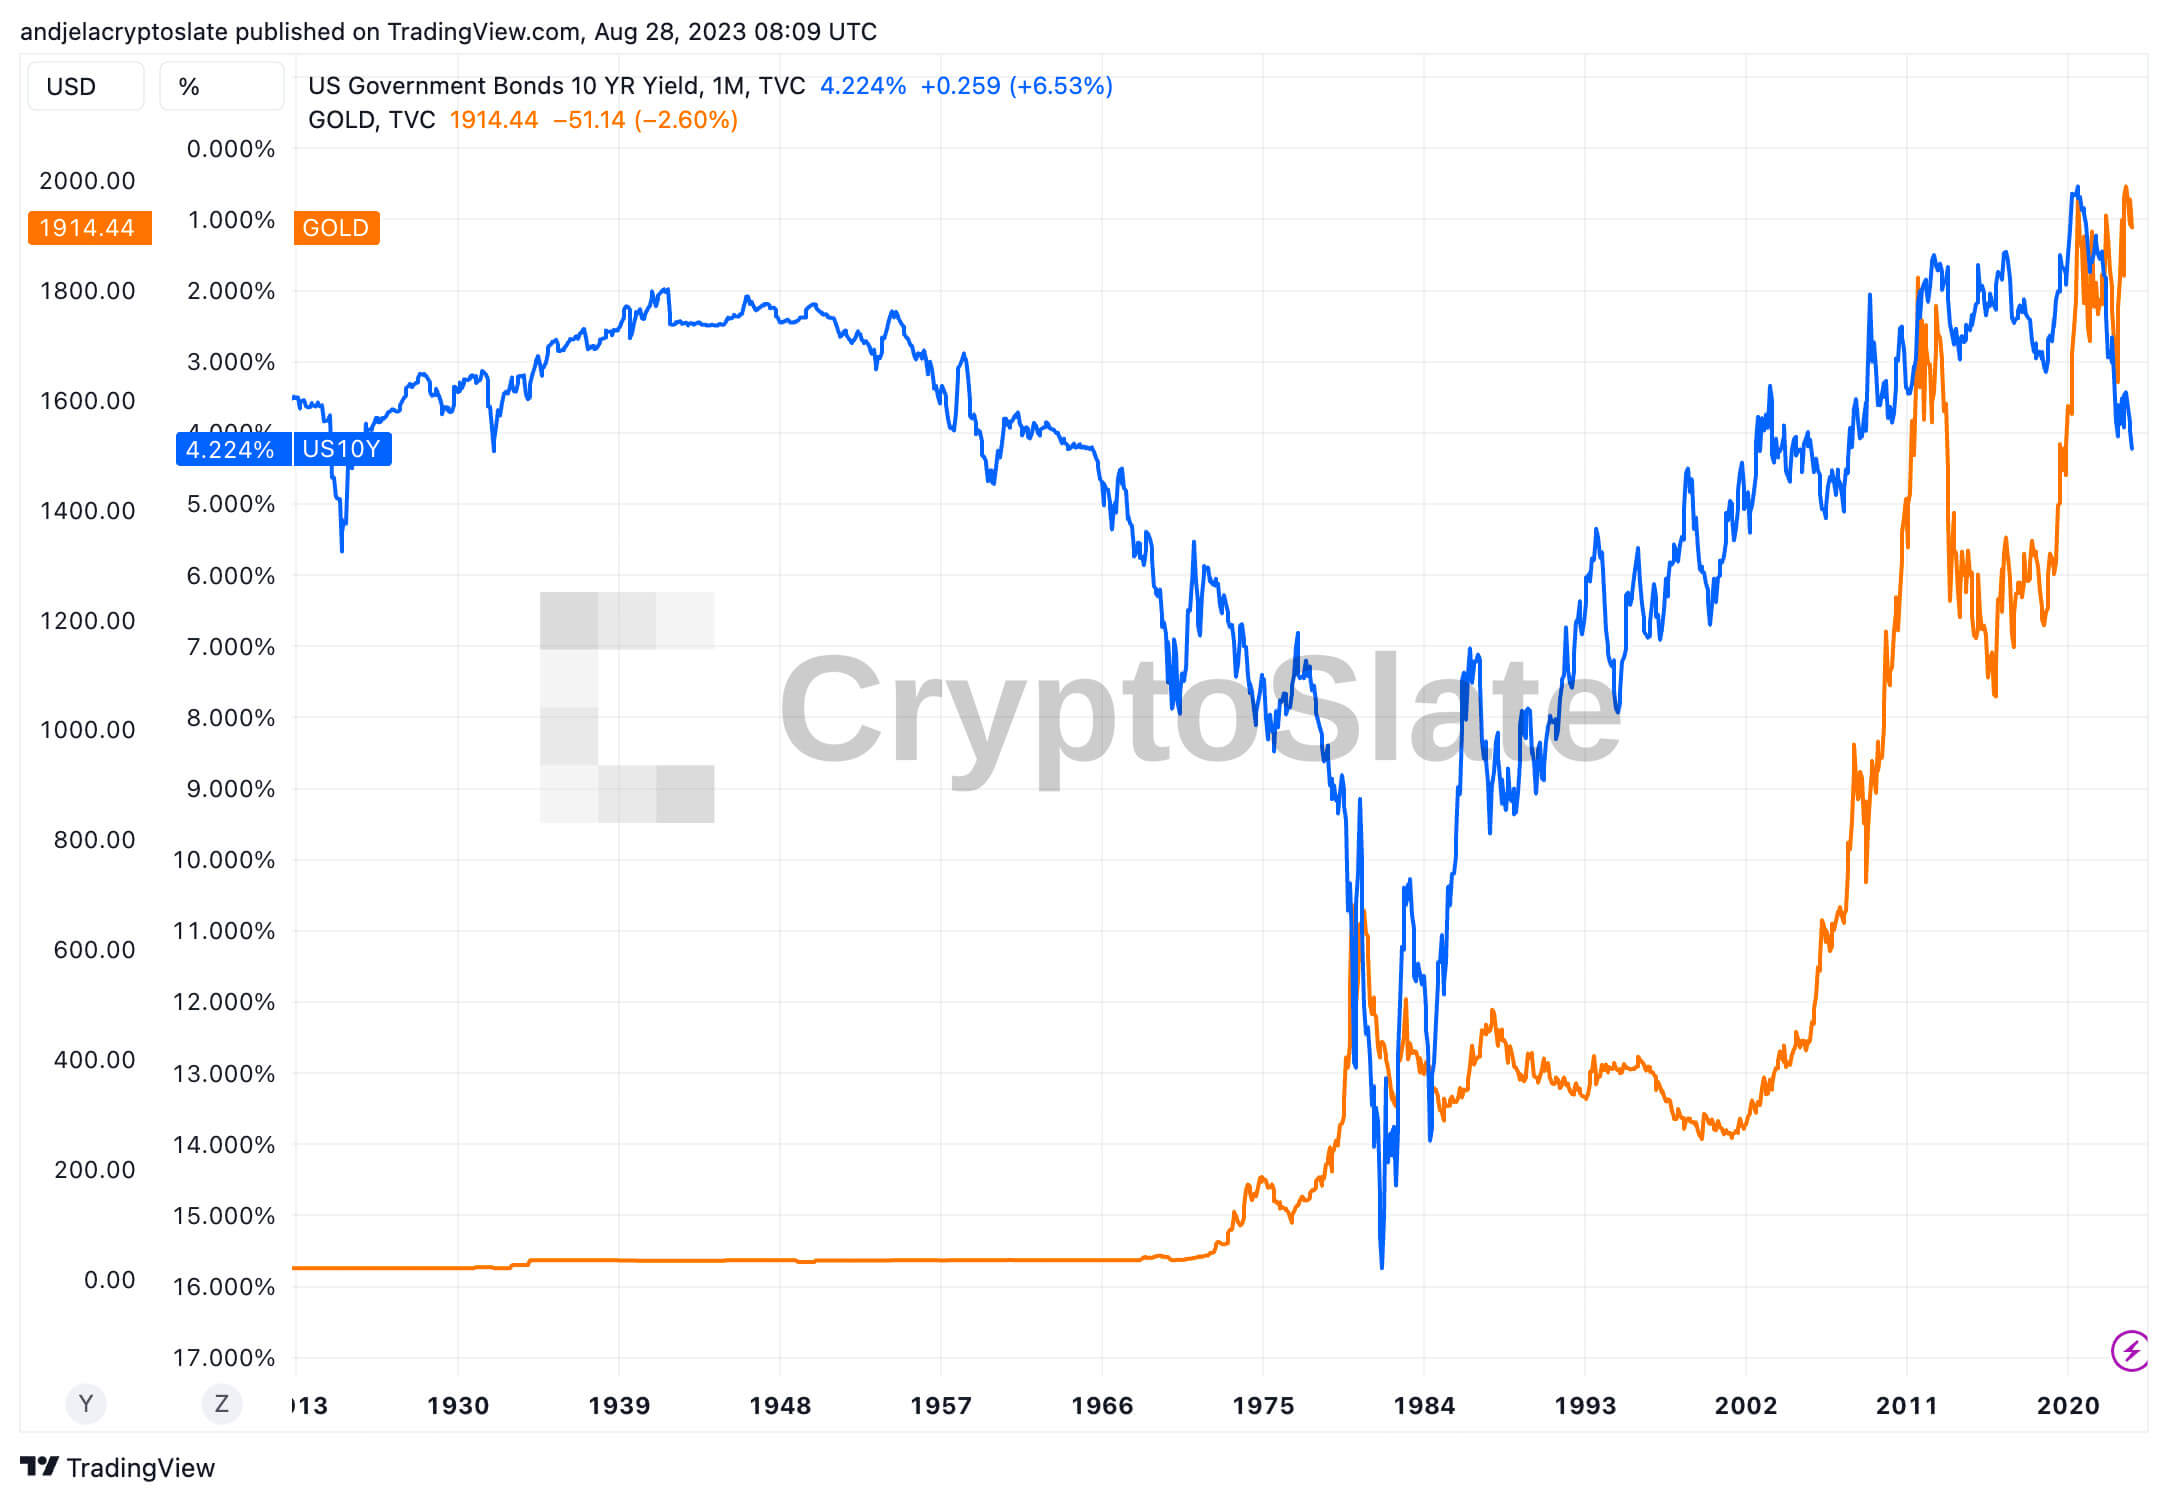
Historically, the 10-year Treasury yield has been a reliable barometer of broader economic sentiment. However, recent data suggests a weakening correlation between this yield and another key asset: gold. This divergence, not seen in decades, has profound implications for investors and the broader market.
The 10-year Treasury yield represents the return on investment for U.S. government bonds with a 10-year maturity. It’s a crucial metric for several reasons.
Firstly, it’s a reflection of investor confidence. When the yield rises, it indicates optimism about the U.S. economy’s prospects. Conversely, a falling yield can signal economic pessimism. Secondly, because the U.S. government backs these bonds, they’re seen as virtually risk-free, making their yields a benchmark for other interest rates, including those for mortgages and corporate bonds.
On the other hand, gold is considered a store of value. Its price often moves inversely to the 10-year Treasury yield. Investors flock to gold as a safe haven when yields are low, indicating economic uncertainty. Conversely, when yields rise, signaling economic optimism, gold often becomes less attractive than income-generating assets.
Recent market trends and global events have disrupted this historically inverse relationship.
In July 2020, the 10-year Treasury yield plummeted to 0.5%, its all-time low. Since then, it has climbed significantly, standing at 4.22% on Aug. 28. Such a rise typically suggests growing economic confidence, which would usually be accompanied by a dip in gold prices. Yet, gold has defied expectations. After peaking at $1,974 in July 2020, it soared to an all-time high of $1,991 by Apr. 3, 2023, and remains strong at $1,914 as of Aug. 28, 2023.
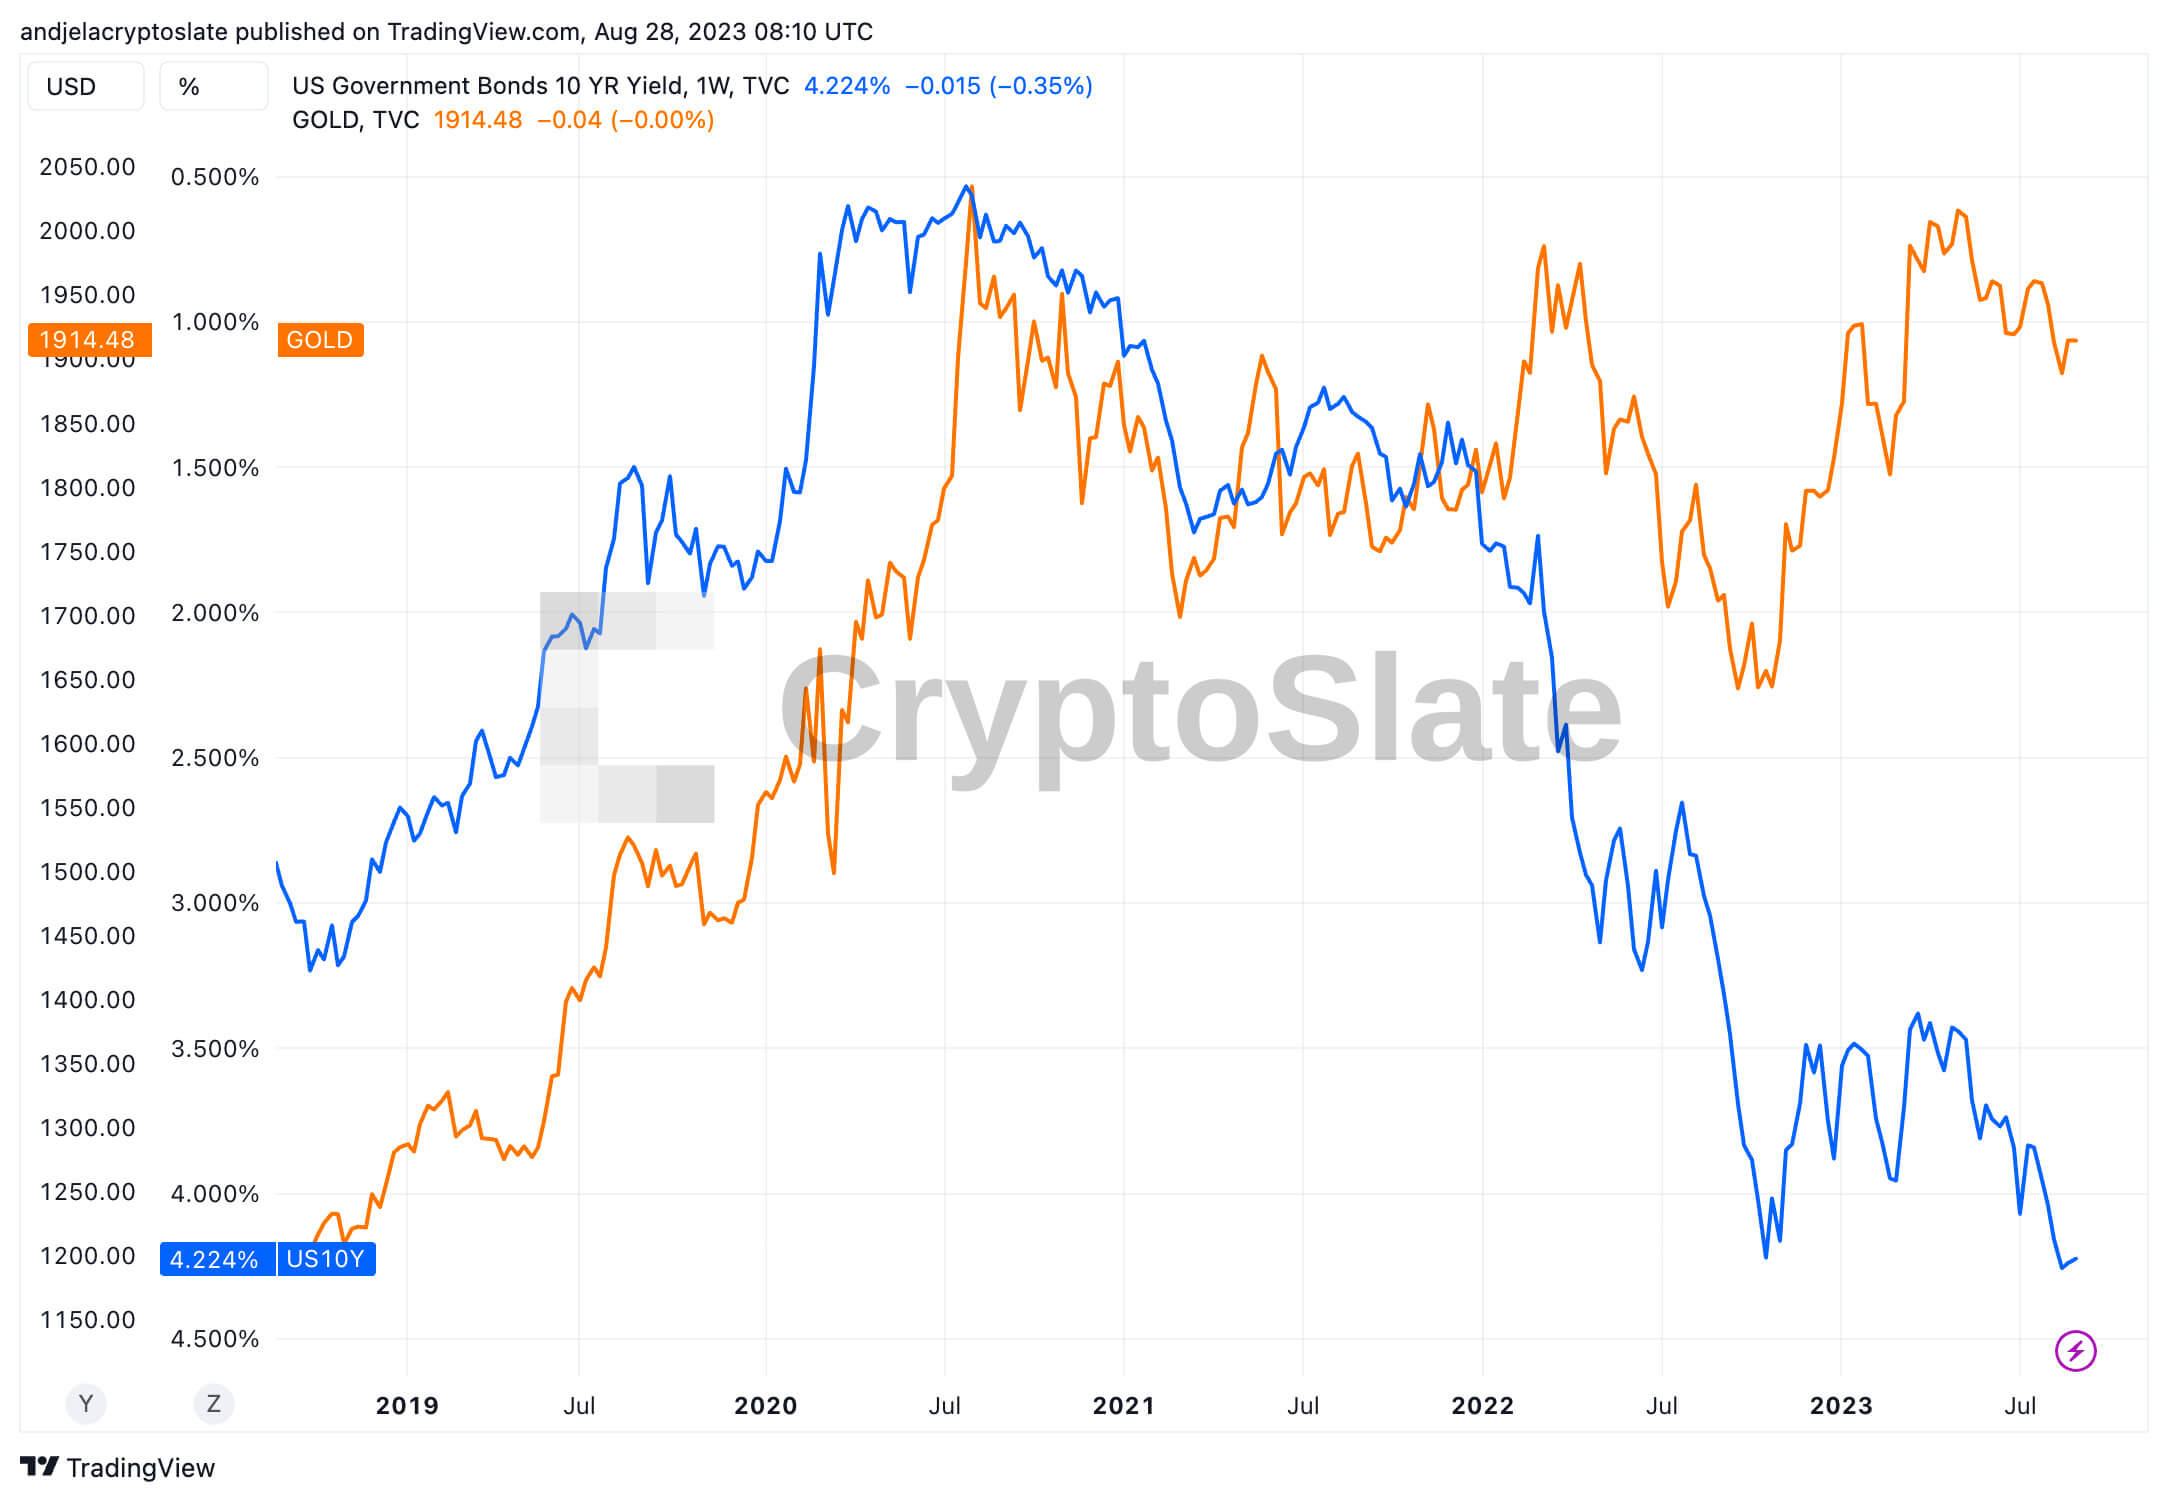
This divergence is significant, and its causes could be multi-faceted, involving various global events and market trends influencing investor behavior. While the rising yield indicates optimism about U.S. economic growth or potential inflation, the resilient gold prices hint at other global factors sustaining its demand and indicate a potential instability of U.S. Treasurys. Factors such as geopolitical tensions, monetary policies, fluctuations in the value of the U.S. dollar, or ongoing concerns about inflation could all contribute to this trend, making gold a more attractive hedge for investors.
This divergence presents challenges and opportunities for the market, creating a new paradigm for investors. They must navigate an environment where traditional correlations, vital for guiding investment strategies, are less certain. This shift might demand new strategies, such as diversifying portfolios or focusing more on individual asset dynamics.
The post Breaking traditions: Why gold prices defy 10-year Treasury yield movements appeared first on CryptoSlate.
Credit: Source link