Quick Take
Bitcoin’s valuation, often viewed as speculative, can be dissected more accurately through the lens of the ‘realized price‘ metric.
This measure, reflecting the average cost at which all current Bitcoin holders purchased their coins, negates the impacts of volatility, thus offering a more realistic view of Bitcoin’s value over time.
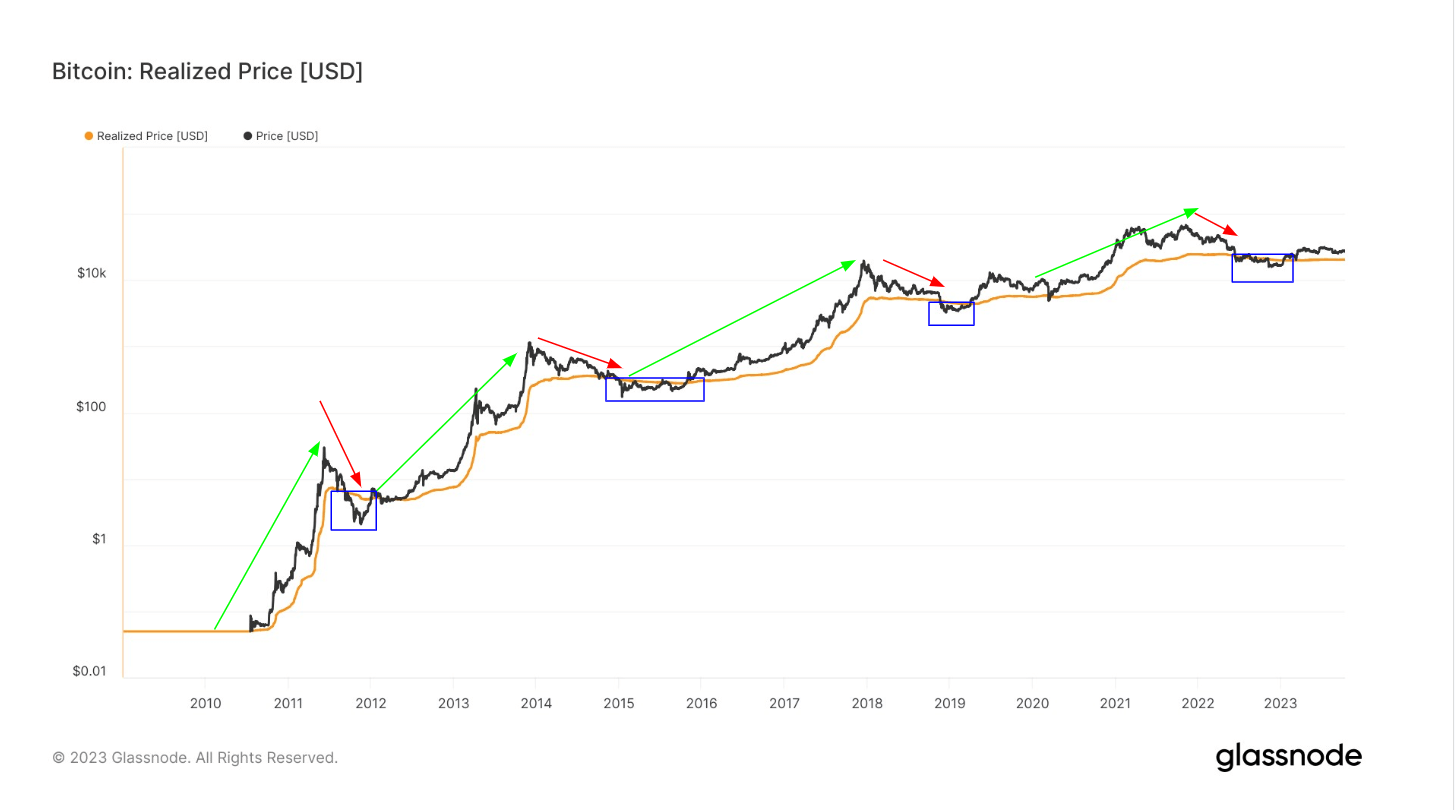
Historical data reveals distinct cycles wherein Bitcoin’s market price traded beneath its realized price, as shown by the blue boxes in the chart below.
Specifically, it saw significant drops in value during the following periods:
- September to December 2011 – Price fell as low as $2.33
- January to October 2015 – Price plunged to $310
- December 2018 to March 2019 – Price dropped to a low of $3,500
- June 2022 to December 2022 – Price reached a low of $15,500
Following these periods, Bitcoin has consistently traded above the realized price, illustrating a robust rebound pattern.
As of 2023, Bitcoin’s price at $26,800 is considered fair against the realized price of $20,300. This continual pattern of ‘higher highs’ demonstrates the inherent resilience of this digital asset.
Historical Bitcoin Realized Price Projections.
Projecting the next bottom cycle based on Bitcoin’s realized price presents an intriguing thought experiment. While historical performance cannot conclusively predict future price action, understanding cycle patterns allows for a more holistic view of the Bitcoin market.
Historical data shows that in 2011, the bottom realized price was $4.50, which surged 55x to $250 in the 2015 bottom cycle.
Subsequently, the bottom in 2019 saw a 22x increase to $5,500.
The 2022 cycle bottomed at $20,000, marking a 3.6x increase.
If we follow this pattern of halving the multiplier with each cycle, the next bottom, hypothetically, could be around $36,000, reflecting a 1.8x increase compared to the 2022 bottom.
Ultimately, this exercise allows us to envision what Bitcoin’s valuation could look like should it follow similar patterns as previous cycles after the upcoming 2024 halving. While the future remains uncertain, contextualizing Bitcoin’s current position relative to past realized price data provides a more explicit framework to anticipate possibilities.
The post Next cycle’s hypothetical $36k Bitcoin floor, exploring historical data to project future benchmarks appeared first on CryptoSlate.
Credit: Source link