Understanding regional market data is becoming increasingly important when analyzing the Bitcoin market. Bitcoin’s global nature means trading activity in one region can significantly influence worldwide price movements. By analyzing where this activity is most concentrated, we can gain insights into which regions exert the most influence on Bitcoin’s price.
Glassnode offers estimates for both the supply and price change of Bitcoin across three major regions: Asia, the European Union (E.U.), and the United States (U.S.). By correlating the timestamps of all transactions created by an address with the working hours of different geographical regions, Glassnode determines the probabilities of each entity’s location. This approach ensures that regional data is as accurate as possible, given the decentralized nature of Bitcoin.
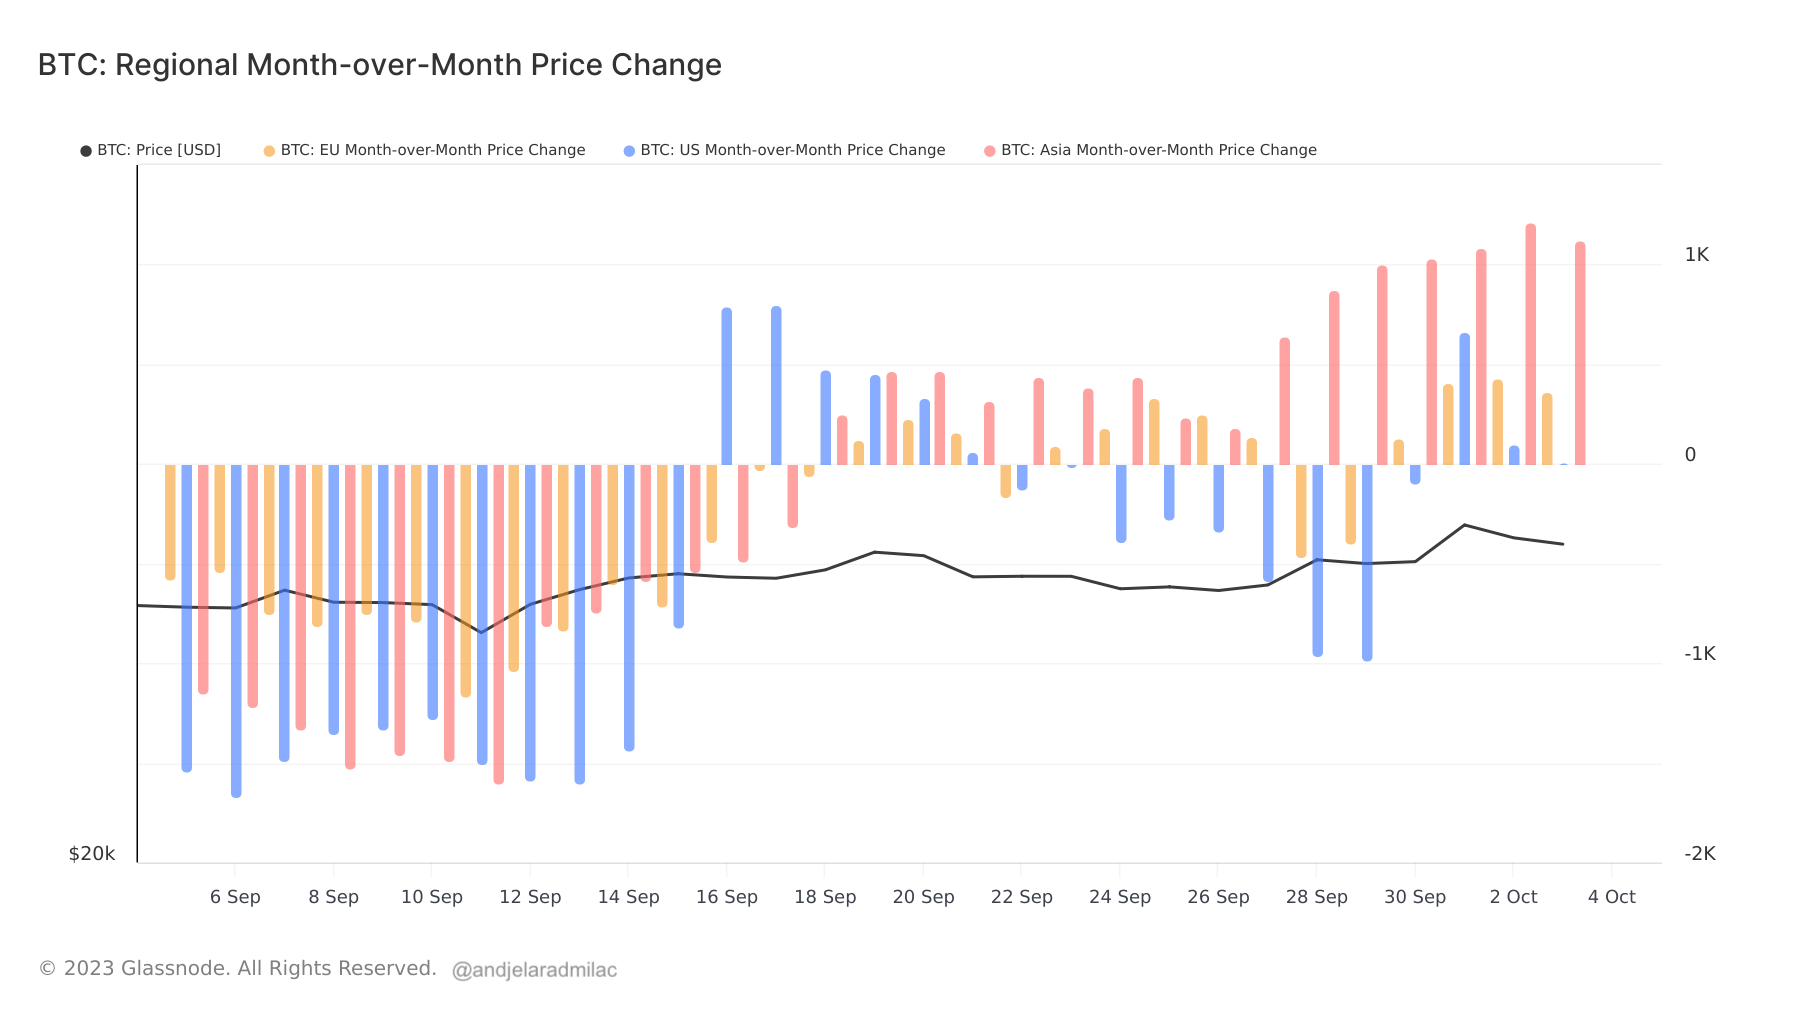
CryptoSlate analysis found that the most significant price movements aren’t coming from the U.S. Instead, the regional month-over-month price changes indicate that Asia is leading the charge. On Oct. 2, the 30-day change in Bitcoin’s price in Asia reflected a substantial increase of $1,214. In contrast, the U.S. and E.U. reported more modest month-over-month price changes of $103 and $431, respectively.
Notably, the U.S. experienced a dip in the last week of September, with its most significant decrease being -$987 on Sep. 29. This suggests that while Asian traders are accumulating Bitcoin, their counterparts in the U.S. and E.U. are more reserved, with the U.S. even showing signs of distribution.
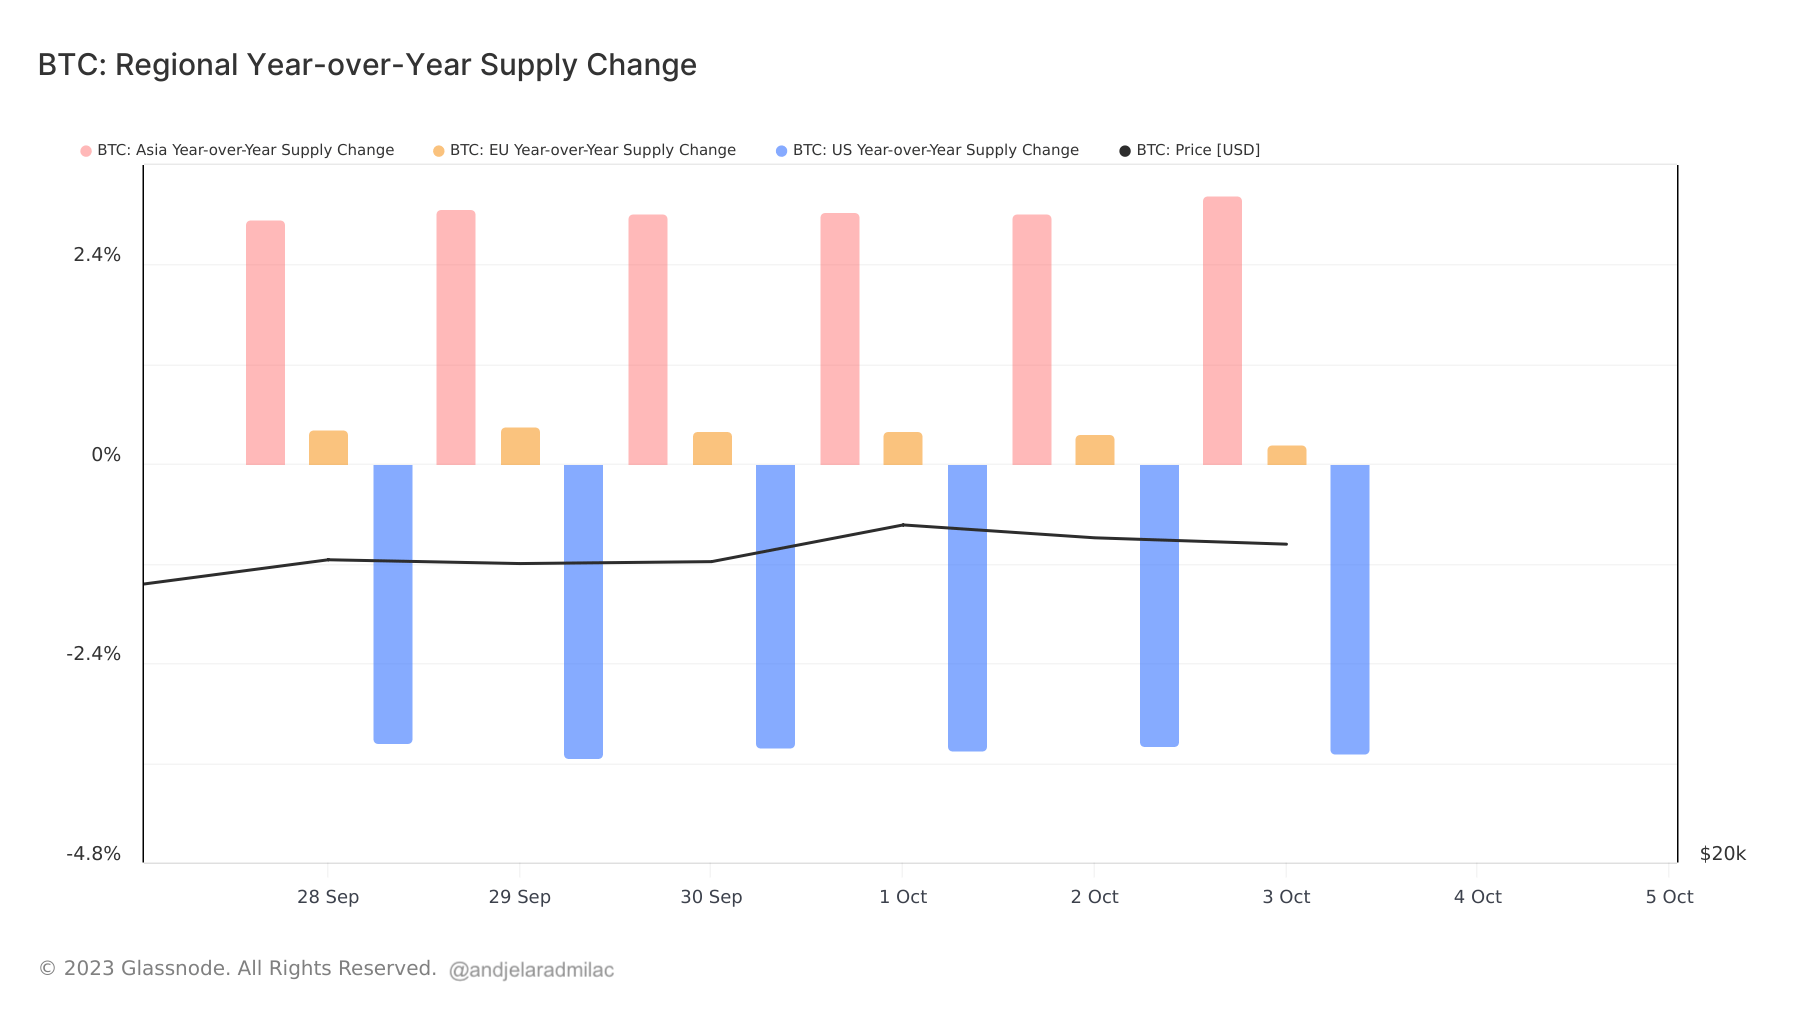
The regional year-over-year supply change offers further insights. On Oct. 3, the Asian Bitcoin supply increased by 3.23% YoY. The E.U. also reported a slight uptick, with a 0.24% increase. However, the U.S. supply showed a decrease of 3.48% YoY.
This decline is part of a broader trend that began in 2022, with the U.S. Bitcoin supply experiencing a gradual deflation. Since Aug. 2022, the U.S. supply has consistently shown negative YoY growth. Interestingly, after years of decline, the E.U. supply began its upward trajectory in Nov. 2022. The Asian supply, on the other hand, has been increasing in tandem with the decrease in the U.S. supply, suggesting a near-perfect inverse relationship.
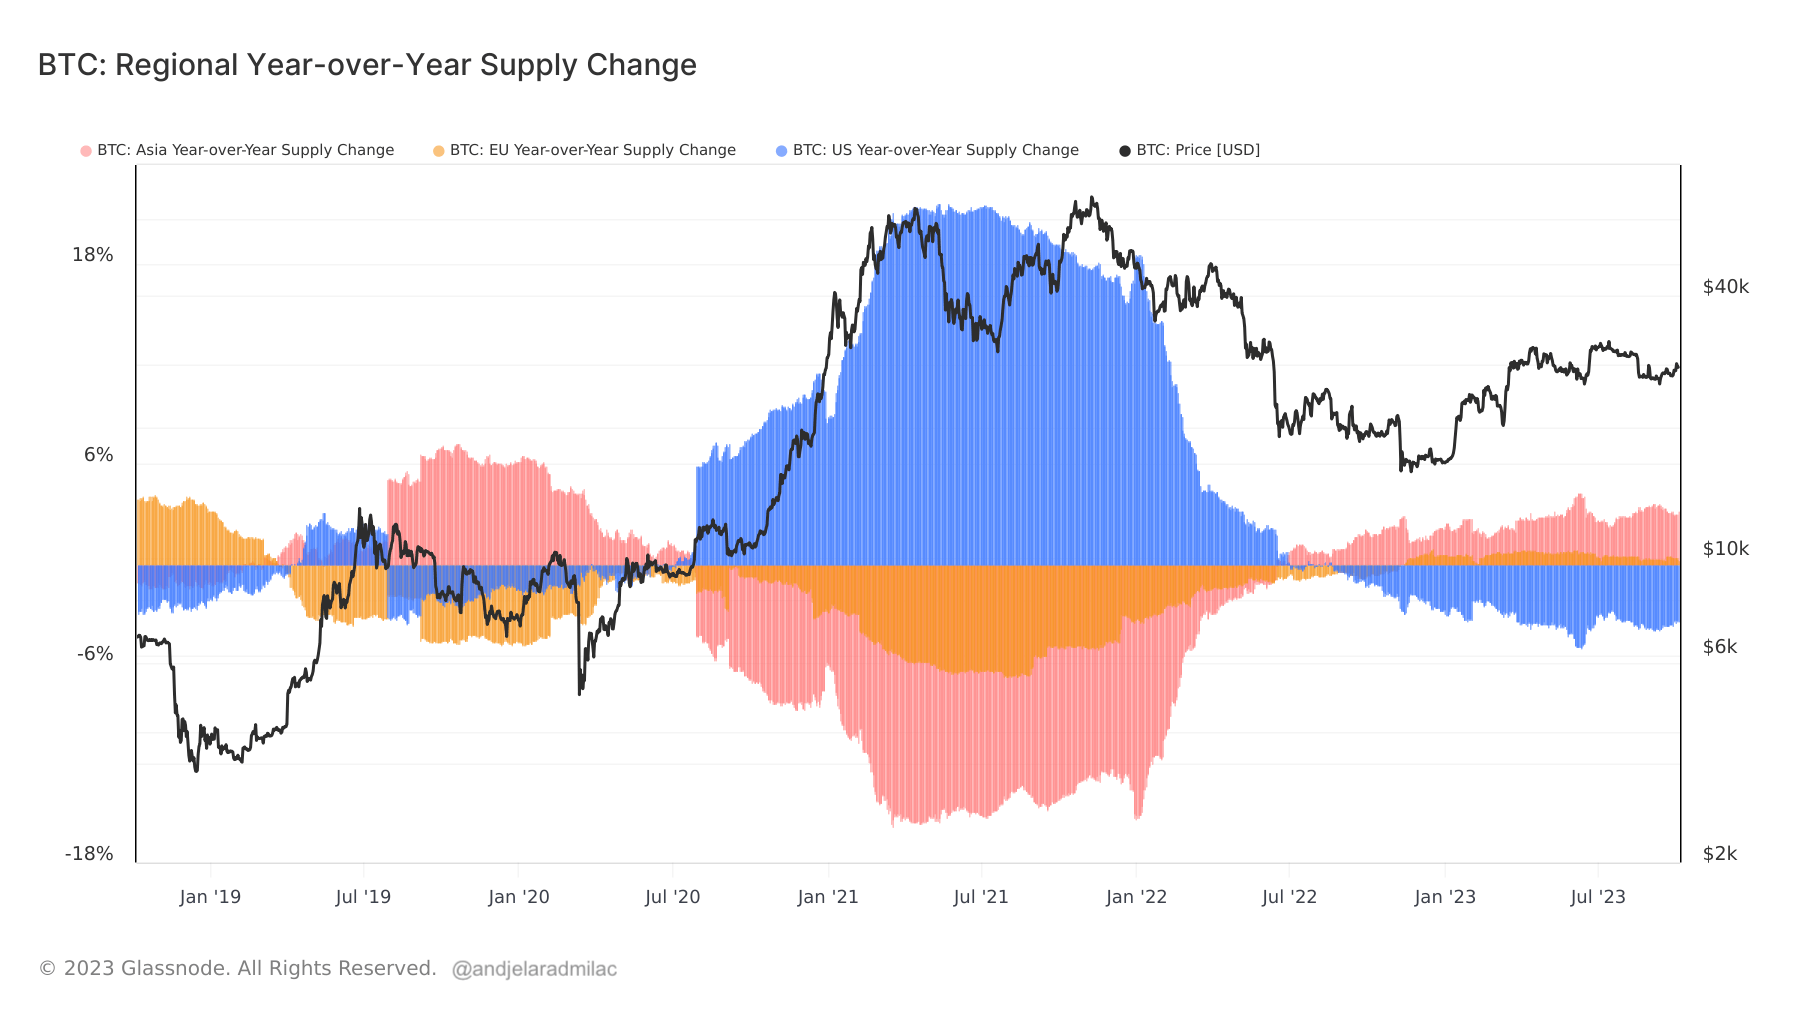
The data suggests that while Asian traders are bullish on Bitcoin, the U.S. and E.U. markets are more cautious. The increase in supply in Asia indicates a growing confidence in the cryptocurrency, while the decrease in the U.S. suggests a more conservative stance. The E.U.’s modest increase could be indicative of a cautious optimism.
Regional data provides valuable insights into the global Bitcoin market. The current trends suggest a shift in market dynamics, with Asia emerging as a dominant force in Bitcoin trading.
The post Bitcoin’s regional dynamics: Asia bullish, U.S. and E.U. in distribution mode appeared first on CryptoSlate.
Credit: Source link