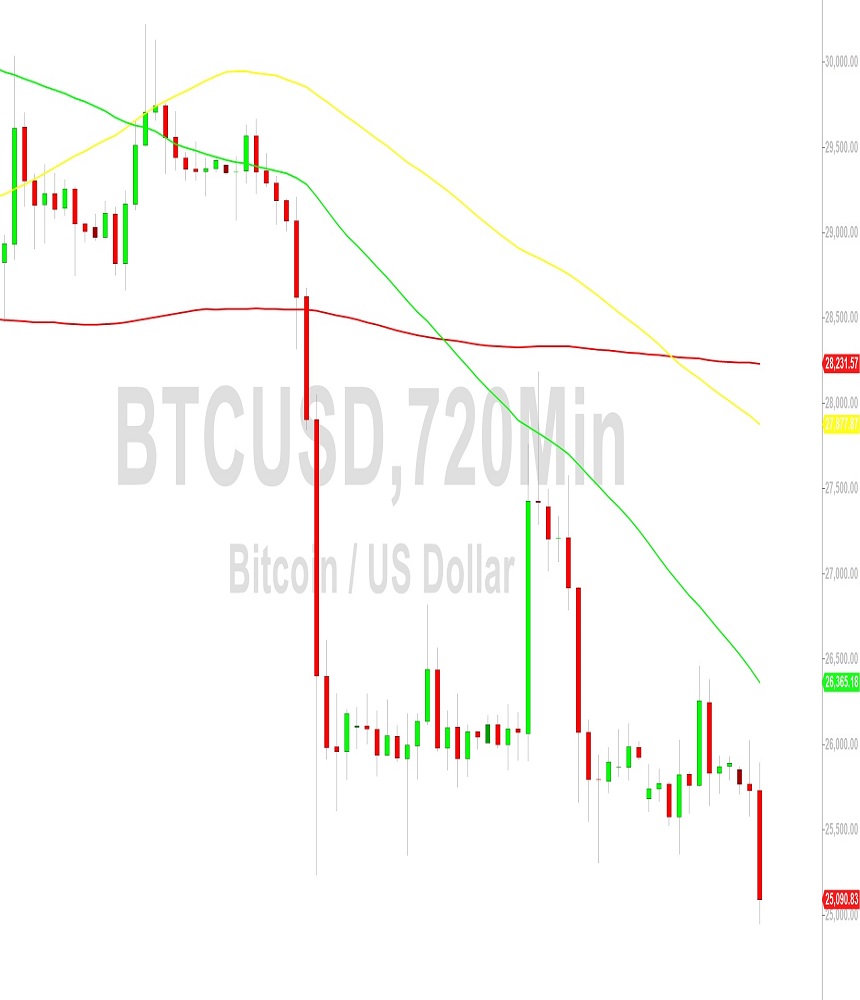
Bitcoin Price Analysis: Multi-Week Lows Below 25000 – 12 September 2023
Bitcoin (BTC/USD) experienced additional bearish momentum early in the Asian session as the pair reached its weakest level since mid-June after Stops were elected below the 25106.61 area, a downside price objective related to recent selling pressure around the 26184.89 and 26480.41 levels. Bears pushed BTC/USD as low as the 24947 area during the initial move lower after a failed test around the 26014.63 area. Stops were also elected below the 25128.94 area, a downside price objective linked to downward pressure around the 30421.29 level. A sustained break below the 25462.40 level will elevate bearish pressure as it is a downward price objective corresponding to significant recent selling pressure around the 28184.89 area.
Stops are cited below the 24197.68 level, a downside price objective related to selling pressure around the 30222 area. Additional price objectives below the market include the 24511, 24339, 24155, 23164, 22949, 21496, and 20702 areas. Technical support and potential buying pressure in appreciating ranges from the 15460 and 19568.52 levels include the 23661, 22793, and 21725 levels. Traders are observing that the 50-bar MA (4-hourly) is bearishly indicating below the 100-bar MA (4-hourly) and below the 200-bar MA (4-hourly). Also, the 50-bar MA (hourly) is bearishly indicating below the 100-bar MA (hourly) and below the 200-bar MA (hourly).
Price activity is nearest the 50-bar MA (4-hourly) at 25821.11 and the 50-bar MA (Hourly) at 25775.33.
Technical Support is expected around 24440.41/ 23270.10/ 22769.39 with Stops expected below.
Technical Resistance is expected around 31986.16/ 32989.19/ 34658.69 with Stops expected above.
On 4-Hourly chart, SlowK is Bearishly below SlowD while MACD is Bearishly below MACDAverage.
On 60-minute chart, SlowK is Bearishly below SlowD while MACD is Bearishly below MACDAverage.
Sally Ho’s Technical Analysis
View Yesterday’s Trading Analysis
Disclaimer: Sally Ho’s Technical Analysis is provided by a third party, and for informational purposes only. It does not reflect the views of Crypto Daily, nor is it intended to be used as legal, tax, investment, or financial advice.
Credit: Source link