

- Litecoin price has retreated 14% in the past 24 hours and 23% in the past week
- Price has also broken below an ascending channel trendline support.
- Can bulls stem post-halving dump?
Litecoin price has declined 14% in the past 24 hours to add to the pain bulls have experienced over the past three weeks. The cryptocurrency, which successfully underwent its third block reward halving early this month, traded to lows of $60.75 and has plummeted 23% in the past week.
Why did Litecoin price go down today?
LTC’s latest price decline came as most top cryptocurrencies by market cap dumped heavily on the back of Bitcoin’s sharp plunge to the $25k area. This was after investors spooked by rumours related to Elon Musk’s SpaceX BTC holdings sold off, with the 24-hour crypto liquidations jumping to over $1 billion on Friday.
The downward pressure cascaded to altcoins, which saw Ethereum nosedive to below $1,575 and XRP touch the technical support area of $0.50. Litecoin’s reaction was for its post-halving rot to deepen and leave bulls poised at a key level that threatens further declines.
LTC price technical outlook
As seen on the daily chart below, the breakdown from highs of $114 in early July has all but wiped pre-halving gains. The psychologically important $100 is once again the primary horizontal resistance level while $60 is now crucial for bulls.
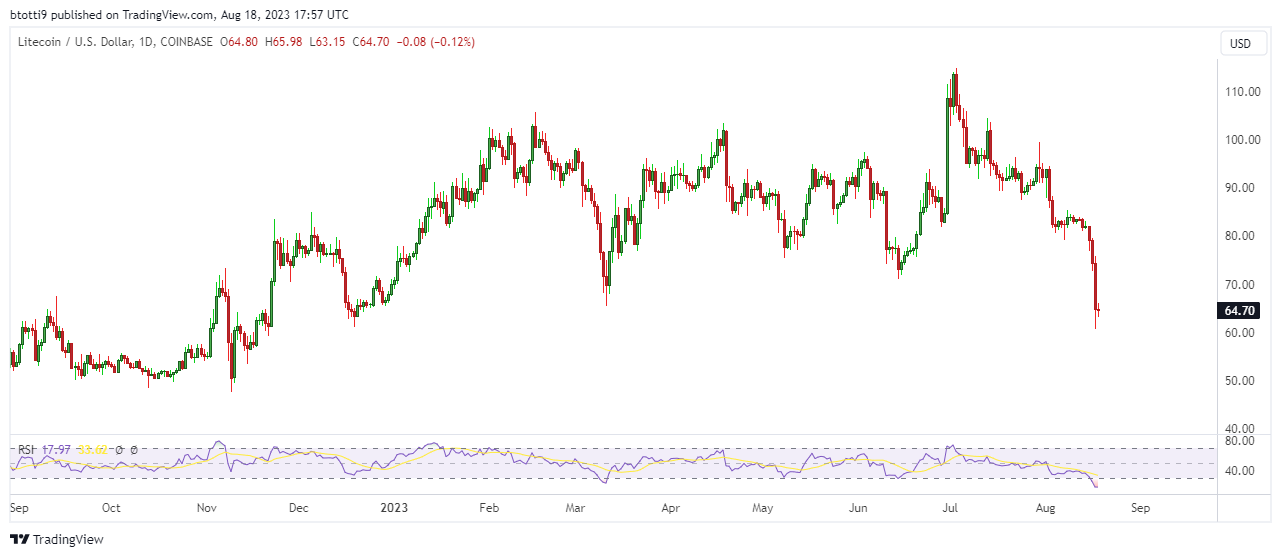 Litecoin price on daily chart. Source: TradingView
The weekly chart also gives a bearish outlook, with the RSI indicator signaling negative momentum. The chart also shows that LTC has broken below the support line of an ascending parallel channel in place since mid-May 2022. The decisive breakdown suggests bears have the upper hand.
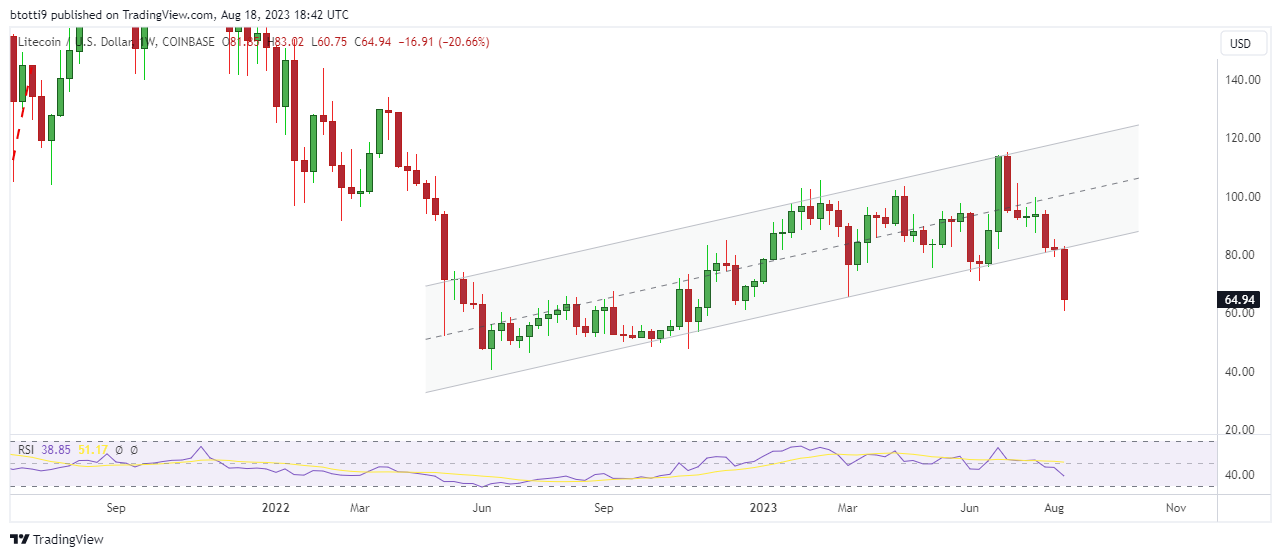 Litecoin price on weekly chart. Source: TradingView
If the price breaks down from $60, Litecoin risks new declines of 30% or more to $40. While a rebound could materialize in the short term, bulls will remain under pressure unless price strengthens in the $80-$100 region.
Credit: Source link