
- RSI stays above 50 in 2023
- The weekly chart points out an ascending triangle pattern
- $45k is the next target, providing the Bitcoin price holds above $25k
Bitcoin bulls must be frustrated by the slow price action in the last few months. After all, ever since it met resistance at the $30k level, Bitcoin moved in a very tight range compared to historical volatility.
But the same happened to the FX market. Volatility remains subdued since the EUR/USD climbed over the pivotal 1.10 level, and now traders wonder what comes next – further upside or a reversal of the bullish trend.
The two are connected.
If one looks at the EUR/USD rally from 0.95 and compares it to the Bitcoin rally from $15,000, similarities can’t be ignored. In other words, it is more of a US dollar’s story than Bitcoin investors accumulating more coins.
Faced with this ambiguity, sometimes it helps to look at the bigger picture and interpret charts. In doing so, the bias for Bitcoin price is bullish.
So here are two technical reasons to buy Bitcoin (or sell the US dollar):
- RSI stays above 50 in 2023
- The weekly chart points out an ascending triangle pattern
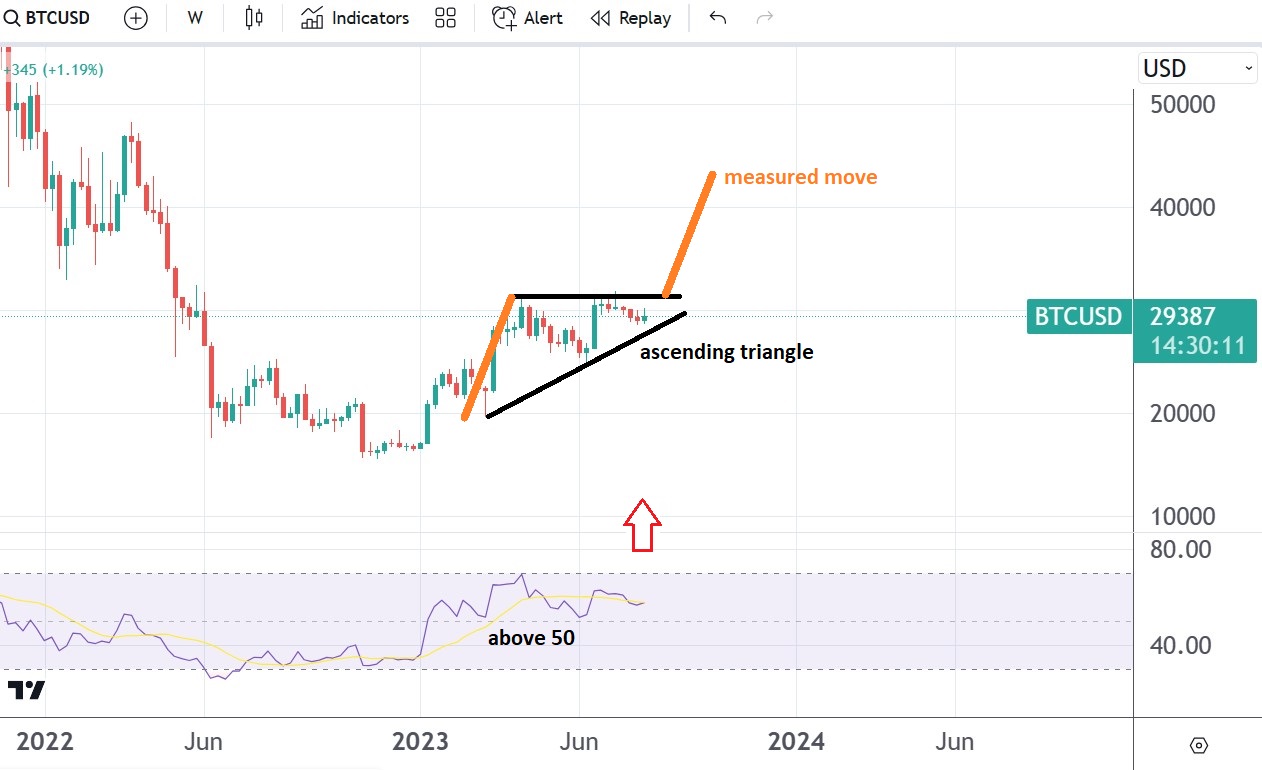
Bitcoin chart by TradingView
RSI holds above 50 in 2023
The first technical bullish setup for Bitcoin comes from the Relative Strength Index (RSI). The RSI is an oscillator, typically displayed at the bottom of a chart.
The main theme of the weekly chart above is Bitcoin’s rally from the 2022 lows. The move from $15k to above $30k resulted in the RSI crossing above 50.
The RSI “oscillates” between overbought and oversold levels, marked with 70, respectively 30. When in-between levels, technical traders focus on the 50 mark. More precisely, when the RSI crosses above 50, the price action is bullish, and when it crosses below, the price action is bearish. Of course, traders should be aware of false breakouts.
But the timeframe above (i.e., weekly) suggests no such thing as a false breakout. Just the opposite, considering that the price action has held above 50 since the start of 2023.
Hence, the bias remains bullish while the RSI holds above 50, and the next move should be a climb into the overbought territory.
An ascending triangle pattern hints at a move above $45k
An ascending triangle is a bullish pattern characterized by the price action pushing against horizontal resistance. Its measured move equals the longest segment in the triangle formation and points to further advances toward the $45k area.
However, there is one condition – the price action must hold above $25k. If it does so, the RSI will stay above 50, meaning Bitcoin’s price will finally build energy to break above horizontal resistance.
Credit: Source link