The Bitcoin mining industry serves as a critical barometer for market health and direction. Among the various tools employed to analyze this vital sector, hash ribbons stand out for their nuanced insights into the state of Bitcoin miners.
Hash Ribbons are a technical indicator that compares two moving averages of Bitcoin’s hash rate: the 30-day simple moving average (30D-SMA) and the 60-day double moving average (60D-DMA).
The hash rate represents the total computational power used to process and validate transactions on the Bitcoin network. Measured in hashes per second (H/s), it directly indicates the network’s security and the miners’ activity.
Analyzing Bitcoin hash rate
Tracking the 30-day simple moving average (30D-SMA) and the 60-day double moving average (60D-DMA) of the hash rate provides insights into short-term and long-term trends in mining activity.
The 30D-SMA offers a view of the recent mining landscape, reflecting short-term fluctuations, while the 60D-DMA smooths out those fluctuations to reveal underlying trends. Together, these metrics form the Hash Ribbons, helping to identify potential miner capitulation or recovery.
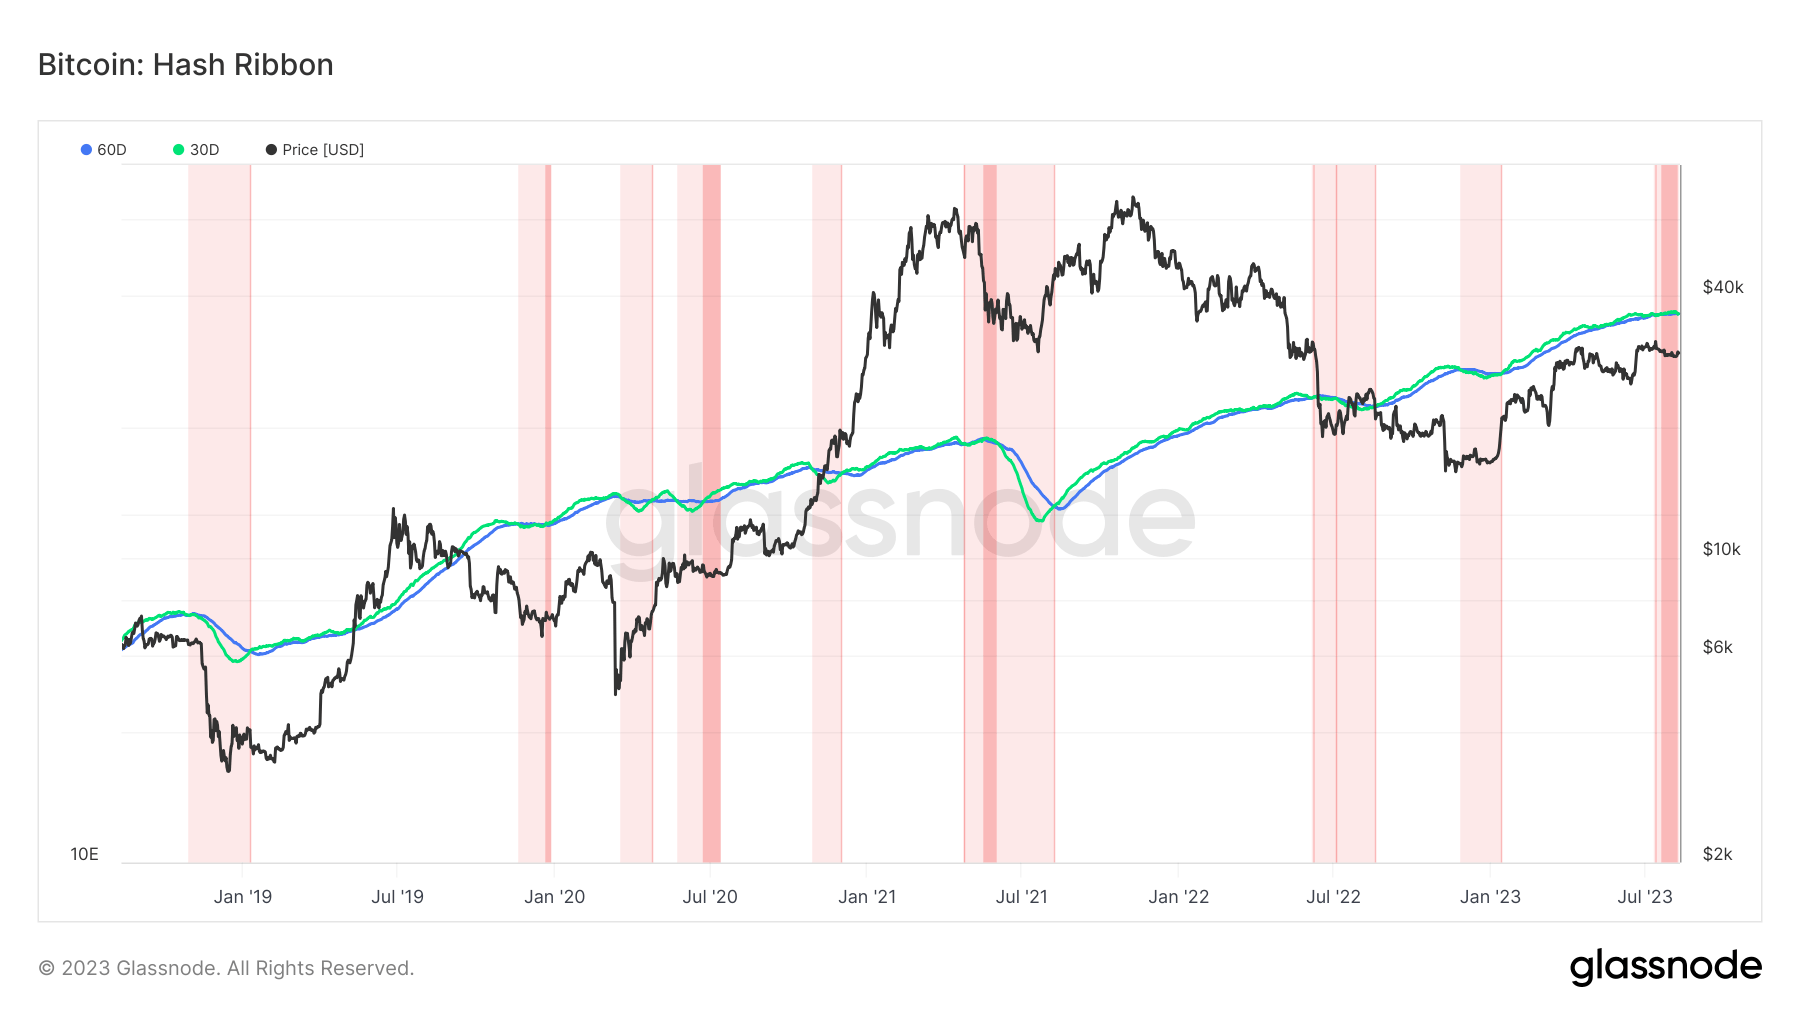
When the 30D-SMA falls below the 60D-DMA, it signals a period of acute miner income stress, known as a negative inversion. Conversely, a positive inversion occurs when the 30D-SMA rises above the 60D-DMA, indicating a recovery period and increased profitability for miners.
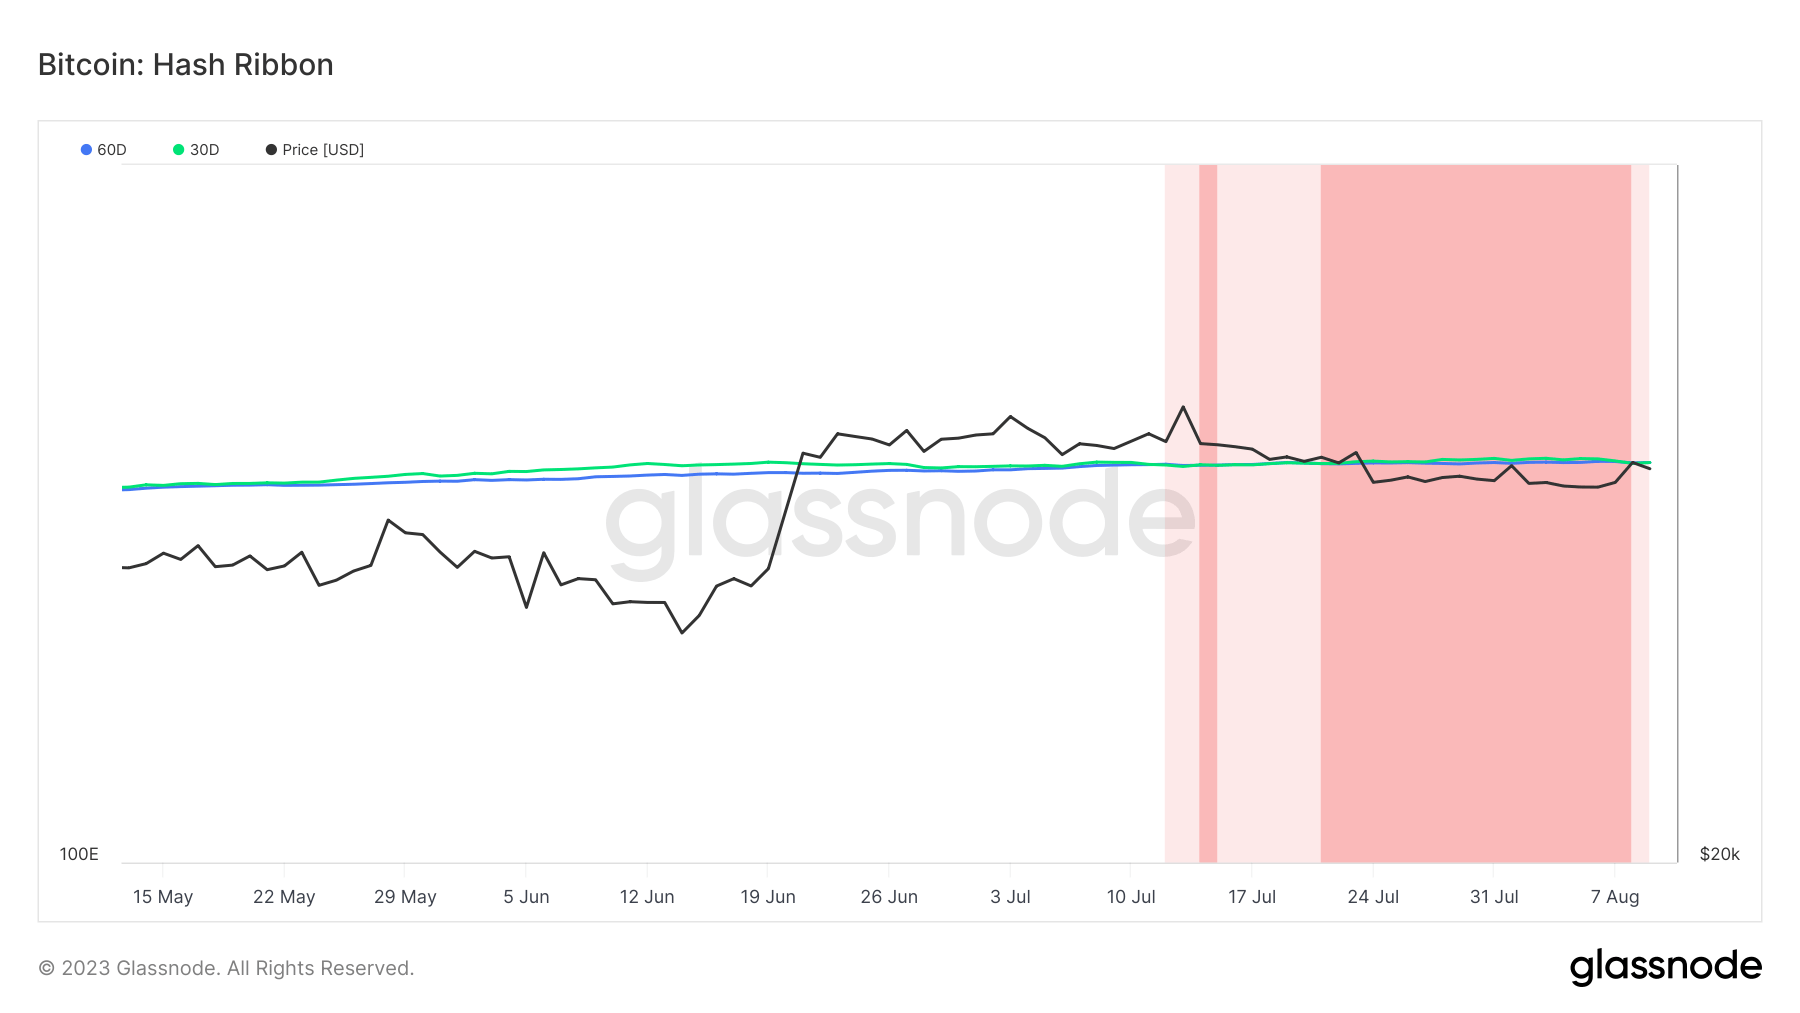
Since July 2023, the hash ribbons have been almost entirely flat, with the 30D-SMA and the 60D-DMA touching and having nearly the same values.
This flat pattern indicates a balanced and stagnant phase in the Bitcoin mining industry. It has mirrored a lack of clear direction in Bitcoin’s price, with the cryptocurrency trading between $28,000 and $30,000 in a tight range.
What it means
The implications of this equilibrium are multifaceted. On the one hand, the stability in the mining industry suggests a lack of significant stress, which can be seen as a positive sign for the overall health of the Bitcoin network.
On the other hand, the absence of clear momentum in either direction reflects a market in a state of uncertainty, potentially awaiting a catalyst to move.
The current flat pattern observed in the hash ribbons might indicate a consolidation phase, suggesting that the market is holding. However, it’s also important to note that such patterns may precede a significant market breakout or breakdown.
Historically, prolonged periods of tight trading ranges accompanied by flat hash ribbons often lead to substantial price movements once a clear direction was established.
The post Bitcoin’s tight trading range mirrored by flat hash ribbons signals impending market movement appeared first on CryptoSlate.
Credit: Source link