
The U.S. stock market fell quite heavily on Thursday which made October the worst month for stock prices since April. The market slid on earnings calls for top tech stocks, and this spread to the cryptocurrency market, where $BTC fell around 3%. With US employment and manufacturing data to be announced later on Friday, uncertainty still reigns in the markets.
US stocks drag Bitcoin down
With Bitcoin (BTC/USD) perhaps poised to continue its assault on the $73,800 all-time high on Thursday, the U.S. stock markets had their very weighty say on the matter. Even though Microsoft, Meta, and Amazon earnings were slightly up, slower future growth and spending expectations caused the market to fall. The S&P 500 slid 2%, and the Nasdaq went down by 3%.
Of course, with all of this negative sentiment happening in traditional markets, Bitcoin certainly wasn’t going to get off scot-free. From what had been a very shallow retracement up to the beginning of Thursday, the price then fell as much as 3.7%, and then dropped as much as a further 2% on Friday before recovering slightly.
$BTC reaches major $69,000 support
Source: TradingView
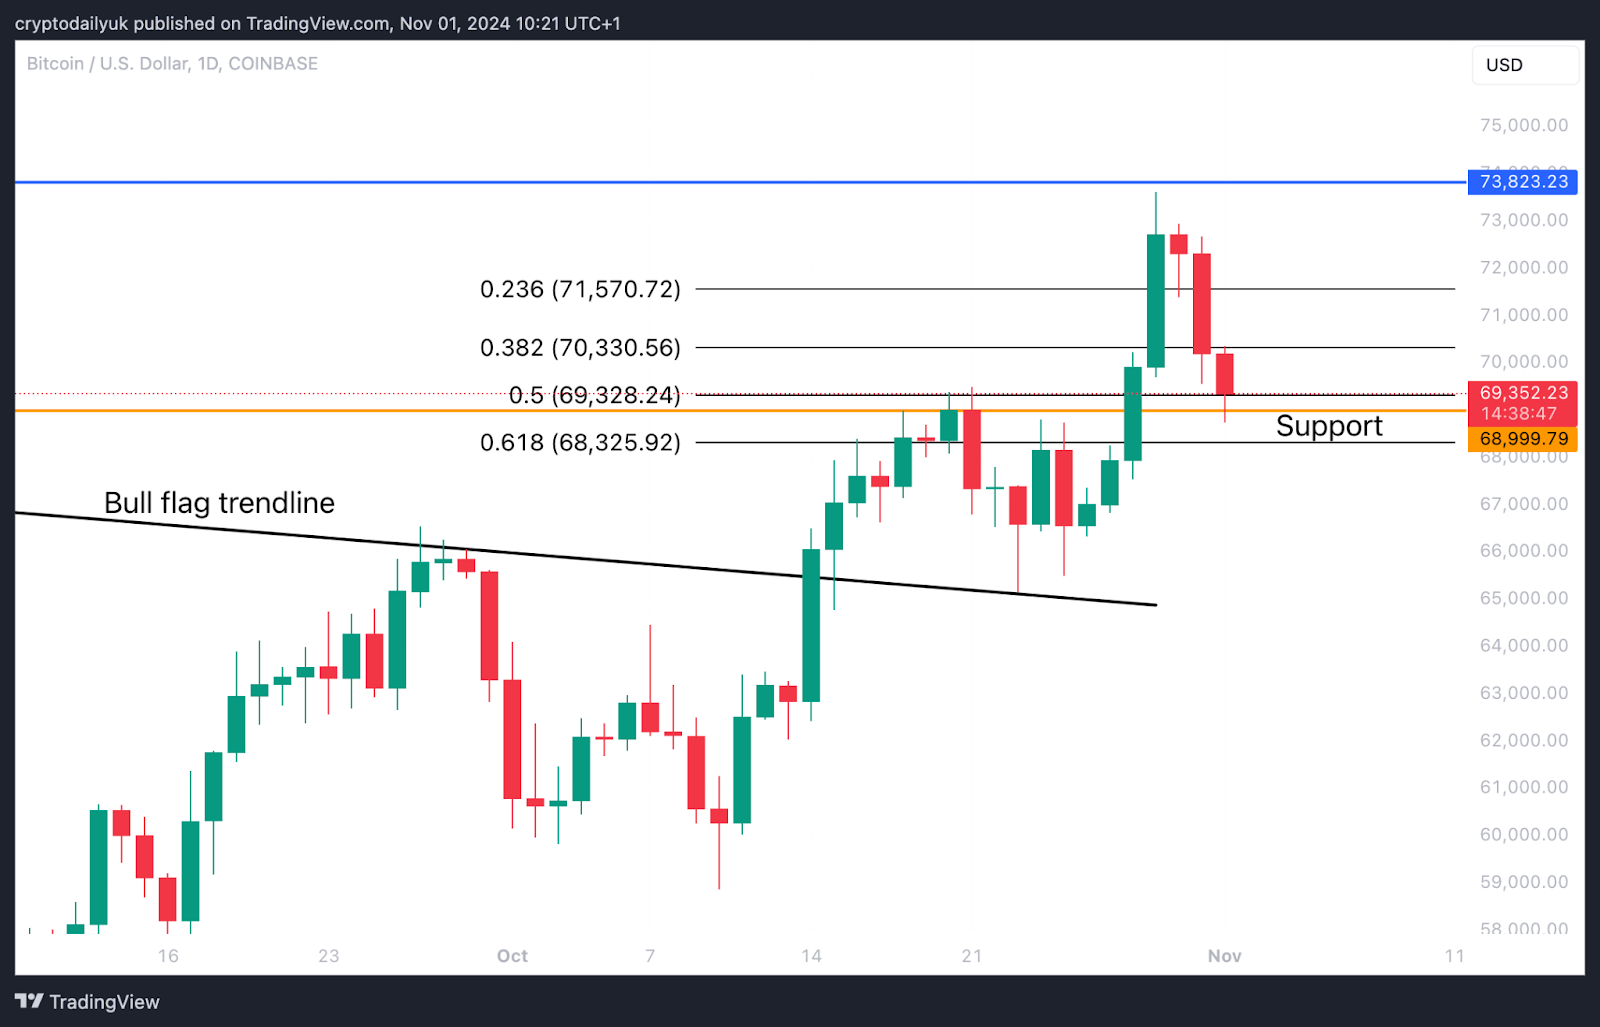
The short-term price chart for $BTC shows the recent rejection from the all-time high. As it stands, things are still continuing to look quite healthy. The retracement came down almost to the 0.618 Fibonacci, and looks to have bounced from the extremely important $69,000 horizontal support, which was the top of the previous bull market in 2022.
If the price does manage to consolidate above this support level, it should allow Bitcoin bulls to build another wave of impetus that can potentially take out the all-time high – perhaps next week. On the other hand, if the price takes hold below $69,000, there could be the danger of a lower low being formed, and a potential break of the short-term trend.
Bearish weekly candle wick to the upside
Source: TradingView
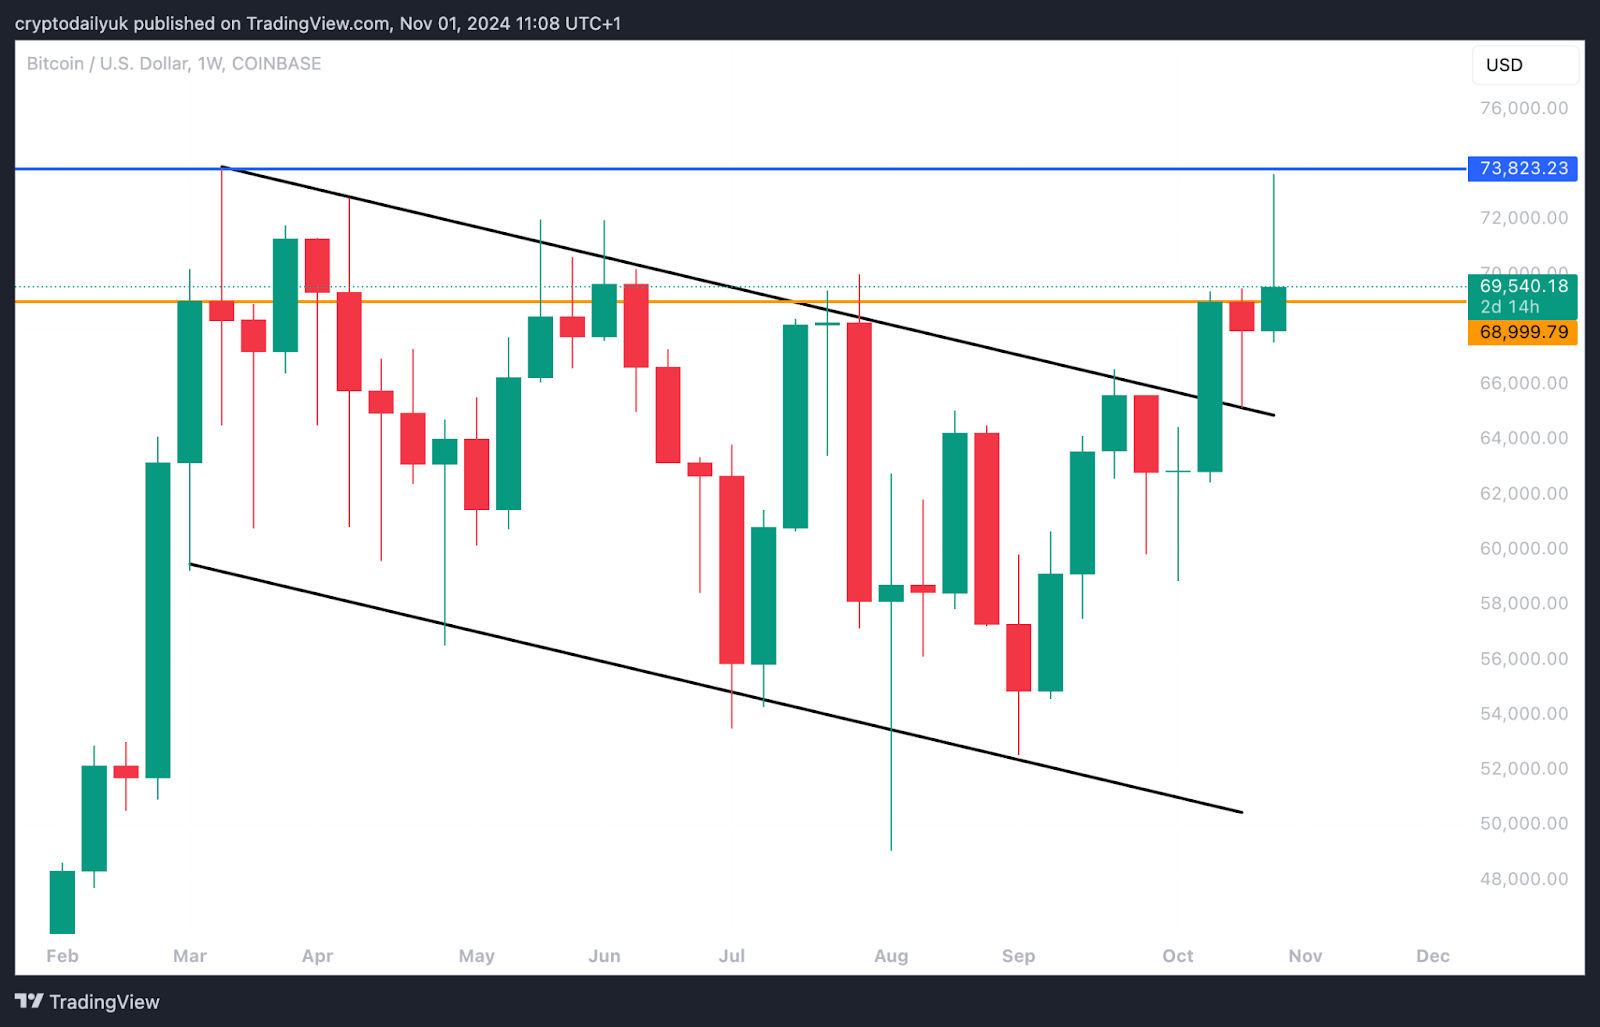
In the weekly time frame there is some danger. The recent drop in price has left a long candle wick to the upside. If this were to remain at the weekly close on Sunday, this would be quite bearish and could augur a lot more choppiness in the Bitcoin price over the coming weeks.
However, the week is not over yet, and the shorter time frame Stochastic RSIs are currently resetting, shortly to provide upside momentum once again.
Monthly chart for $BTC is promising
Source: TradingView
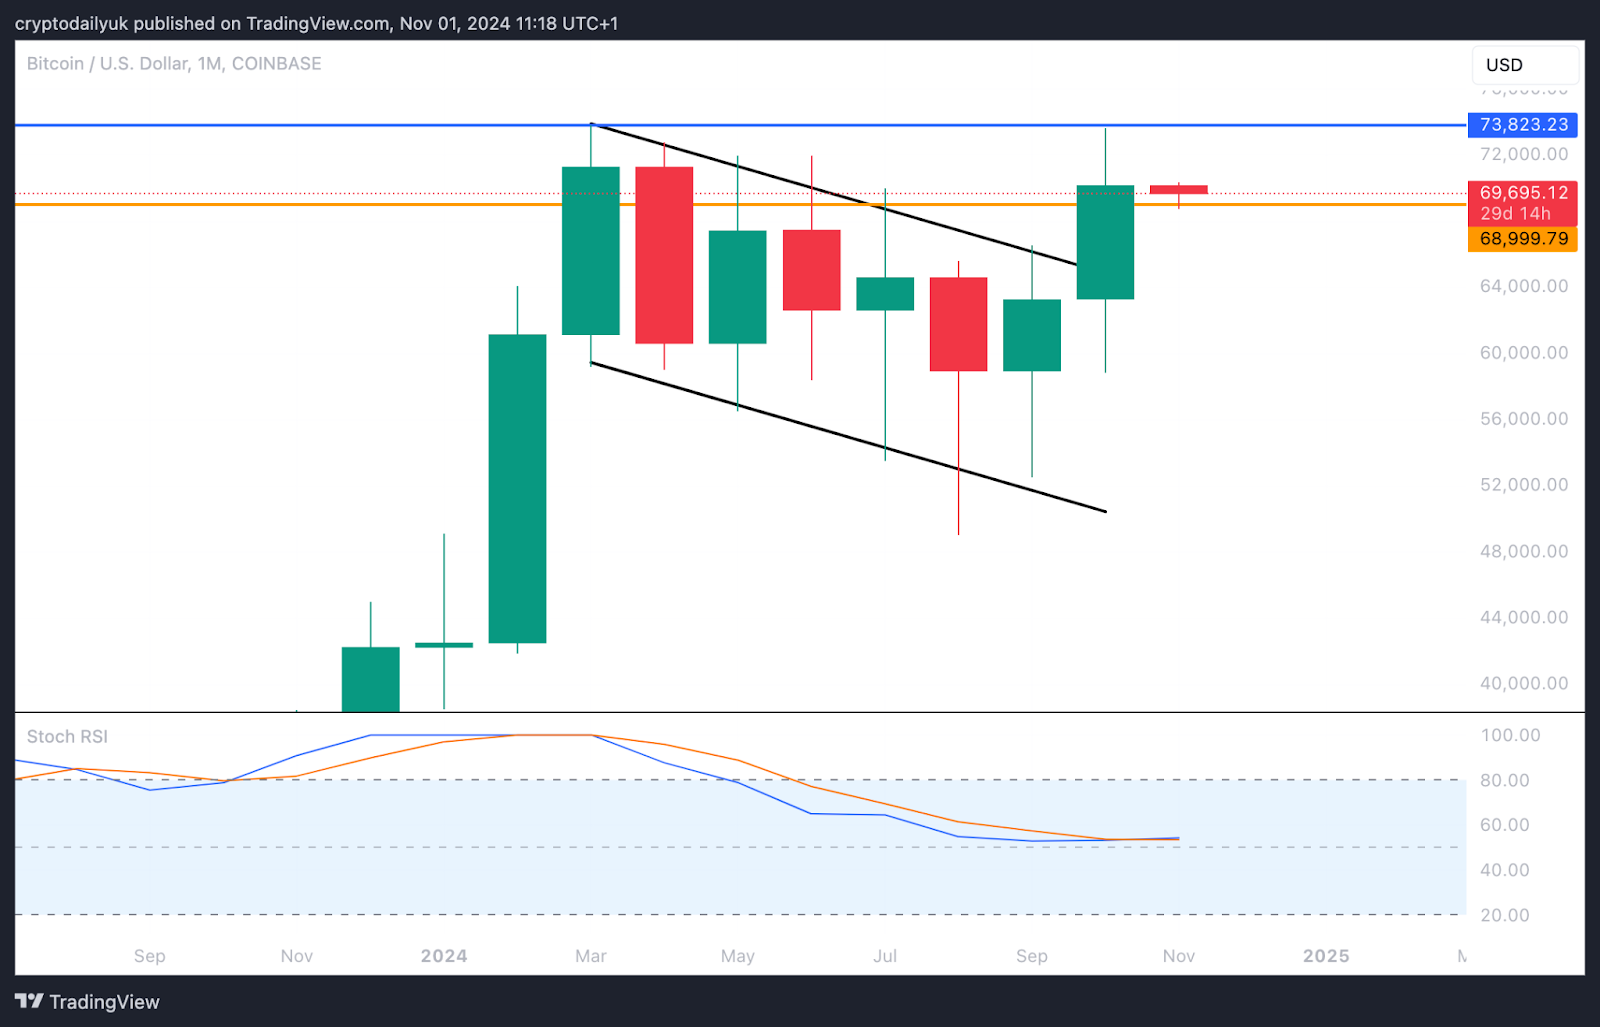
Zooming even further out into the monthly time frame, things look rosier. It does need to be pointed out that the October candle was rejected before it could make an all-time high, and it is an indecision candle. Nevertheless, it is also signalling a continuation of the upward trend.
What is more important is that the first monthly candle body could close above the critical $69,000 resistance, and the monthly Stochastic RSI has confirmed a cross up – potentially signalling some huge upwards price momentum.
November is going to be a critical month one way or the other.
Disclaimer: This article is provided for informational purposes only. It is not offered or intended to be used as legal, tax, investment, financial, or other advice.
Investment Disclaimer
Credit: Source link