
Table of Contents
Polkadot (DOT) tested its support level on Friday after spending almost all week in the red. However, DOT was able to bounce off its support level as it continues to find buyers around the $4.20 price level.
Traders and market watchers are closely monitoring the $4 and $4.20 price levels, which have emerged as key psychological support levels.
A Difficult Week For Polkadot (DOT)
Polkadot (DOT) has endured a bearish week since dropping into the red on Sunday, ending the previous week with a 3.21% drop. As buyers lost steam, sellers could regain control, and DOT dropped over 5% on Monday, slipping below the 20-day SMA and settling at $4.56. Buyers attempted to re-establish control on Tuesday as DOT rose to a day high of $4.66. However, sellers thwarted the recovery attempt, and DOT fell back in the red for the third consecutive day, losing the $4.50 level and settling at $4.38. Wednesday saw a continuation of selling pressure as DOT fell by 2.74% to $4.26, as sellers looked to drive the price below the $4.20 support levels.
Source: TradingView
With DOT close to its support level, buyers attempted another recovery on Thursday, pushing DOT to a day high of $4.40 as they looked to reclaim $4.50. However, with demand drying up at higher levels, DOT fell back once more, registering a marginal drop of 0.23%. Crucially, buyers kept DOT above the support level at close. DOT tested the support level on Friday as sellers yanked the price to a day low of $4.10. Sellers lost steam as buyers entered the market between $4 and $4.20, pushing the price up to $4.29 after an increase of 0.94%. The current session sees DOT up by 0.70%, trading at the $4.32 mark. If buyers can sustain this recovery, they will look to reclaim the $4.50 price level. With strong support at the $4.20 level, sellers have been unable to exert their influence at lower levels.
Sentiment Uncertain
Market sentiment around Polkadot (DOT) remains uncertain. At the same time, the $4.20 level has acted as a level of support and prevented the price from dropping lower. However, they have been unable to gather momentum and initiate a significant recovery so far. The MACD indicates that bears could be gaining the upper hand if trends around DOT remain sluggish. Open interest has also declined over the past week, although the past couple of days have reported a marginal increase.
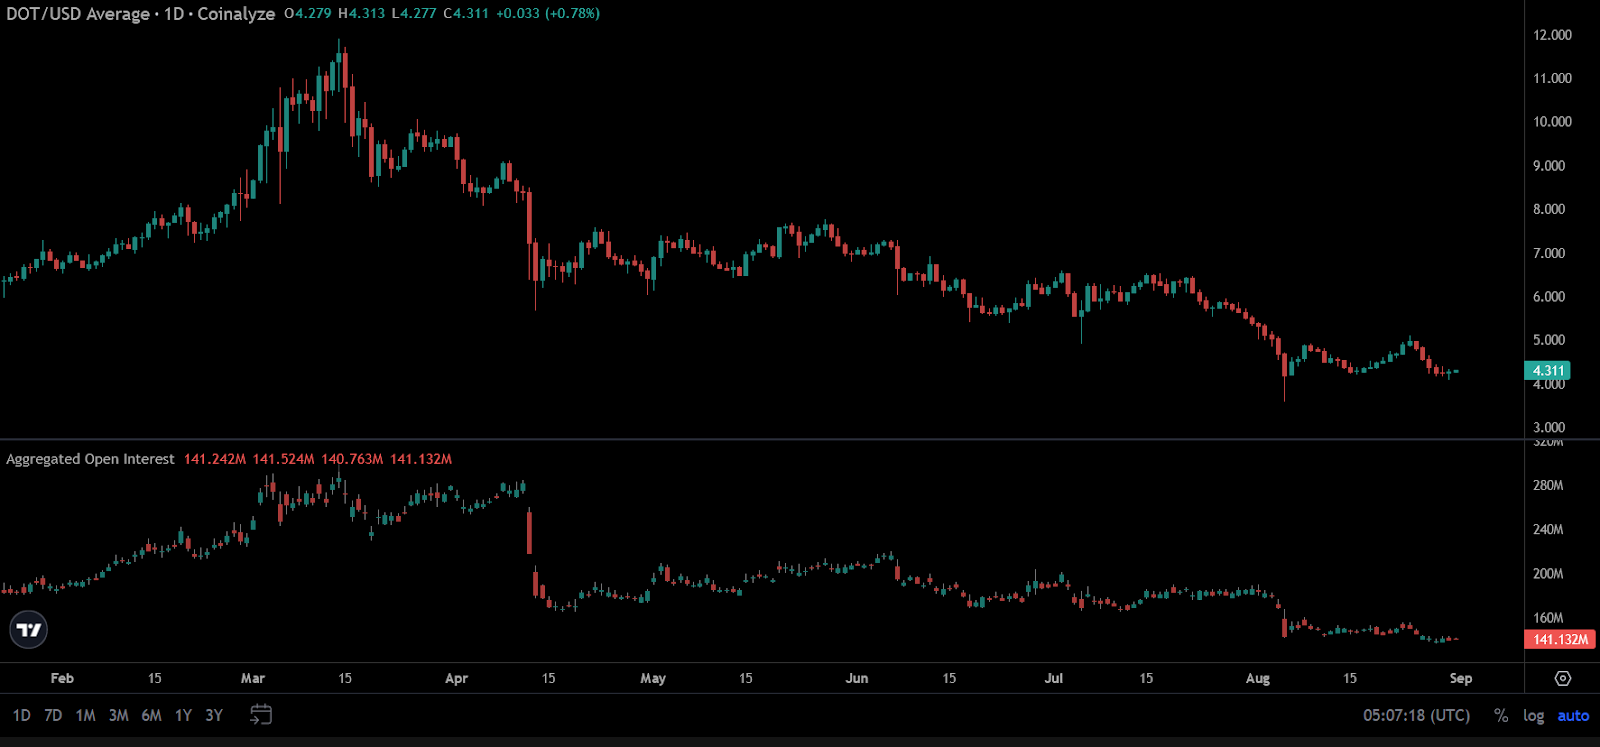
Source: Coinalyze
So, where does DOT go from here? If buyers can keep DOT above its support level and push above $4.50, the price could resume its push to $5. However, for such a scenario to play out, DOT must stay above $4.20. But what happens if sentiment changes? Should sellers regain control and push DOT below $4.20, the price could drop to $4, where buyers could attempt to start a relief rally. Should this level be breached, it will bring DOT’s multi-year support level of $3.60 into focus.
Disclaimer: This article is provided for informational purposes only. It is not offered or intended to be used as legal, tax, investment, financial, or other advice.
Investment Disclaimer
Credit: Source link