Since Ethereum’s Merge on Sep. 15, 2022, the crypto industry has been abuzz with discussions about its supply dynamics. The Merge marked the network’s transition from a Proof-of-Work (PoW) consensus mechanism to a Proof-of-Stake (PoS), significantly altering its issuance rate. This transition, coupled with the implementation of EIP-1559 in August 2021, has led to oscillations in Ethereum’s supply between inflationary and deflationary states.
In the immediate aftermath of the Merge, Ethereum’s supply exhibited deflationary characteristics. This deflationary trend was primarily driven by the burning mechanism introduced by EIP-1559, which removes a portion of the transaction fees from circulation.
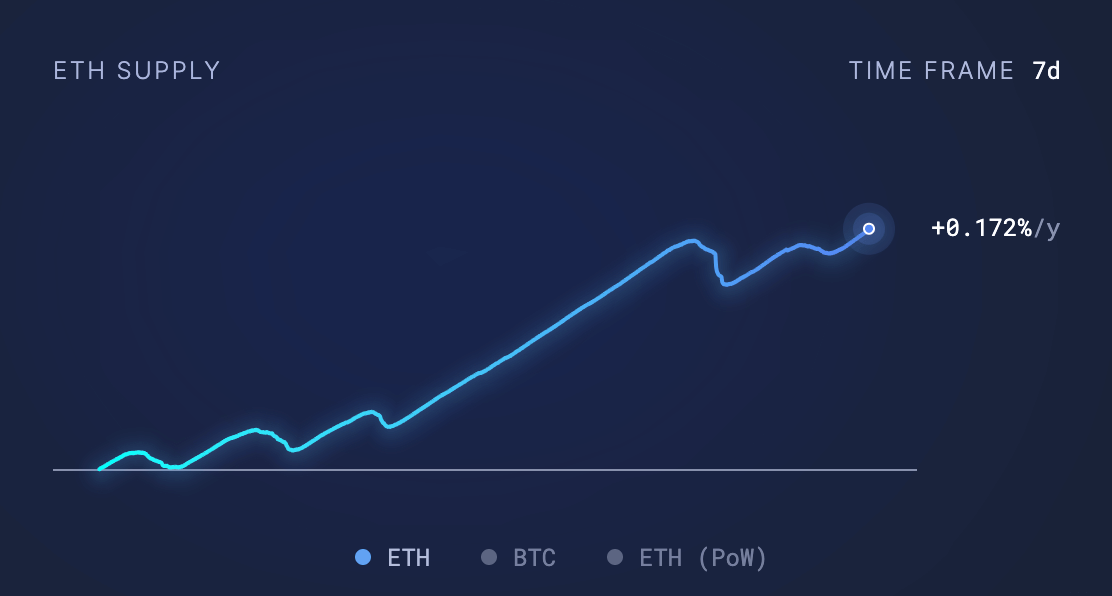
However, observing the supply over shorter time frames shows inflationary tendencies, with an inflation rate of +0.172% observed over a 7-day period.
Over a 30-day period, this inflation stands at +0.013%.

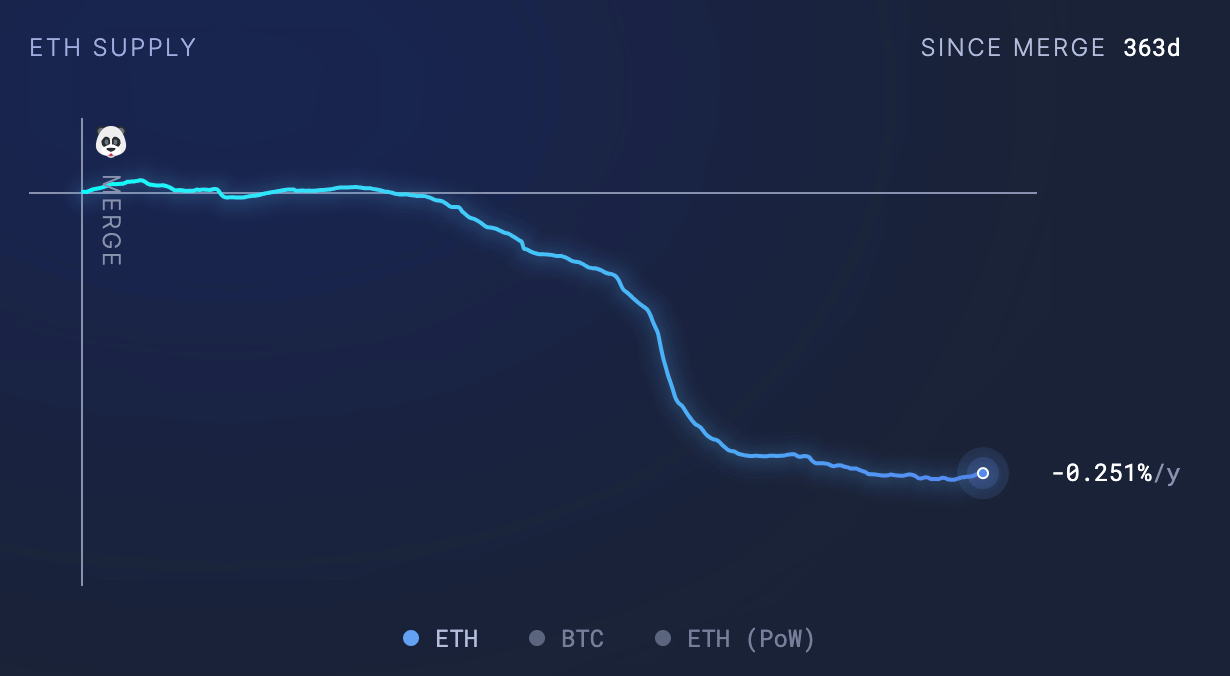
Yet, when zooming out to consider the broader picture since the Merge, Ethereum’s supply remains deflationary, decreasing by -0.251%.
The oscillation between inflationary and deflationary states has profound implications for Ethereum and its stakeholders.
A deflationary asset, by nature, tends to increase in value over time due to its increasing scarcity. This could enhance Ethereum’s value proposition as a store of value similar to Bitcoin, potentially attracting more investors. However, prolonged deflation could also lead to hoarding behaviors, potentially reducing Ethereum’s velocity and utility as a medium of exchange.
On the flip side, a consistently inflationary supply ensures that validators in the PoS system are rewarded for their efforts in securing the network. This continuous issuance of new ETH can provide economic security and sustainability for the Ethereum network.
However, there is a potential dilution of value for existing ETH holders and a possible decrease in the purchasing power of ETH. Continuous inflation could exert downward pressure on the price of ETH. If the rate of new ETH issuance outpaces demand, the price could decrease.
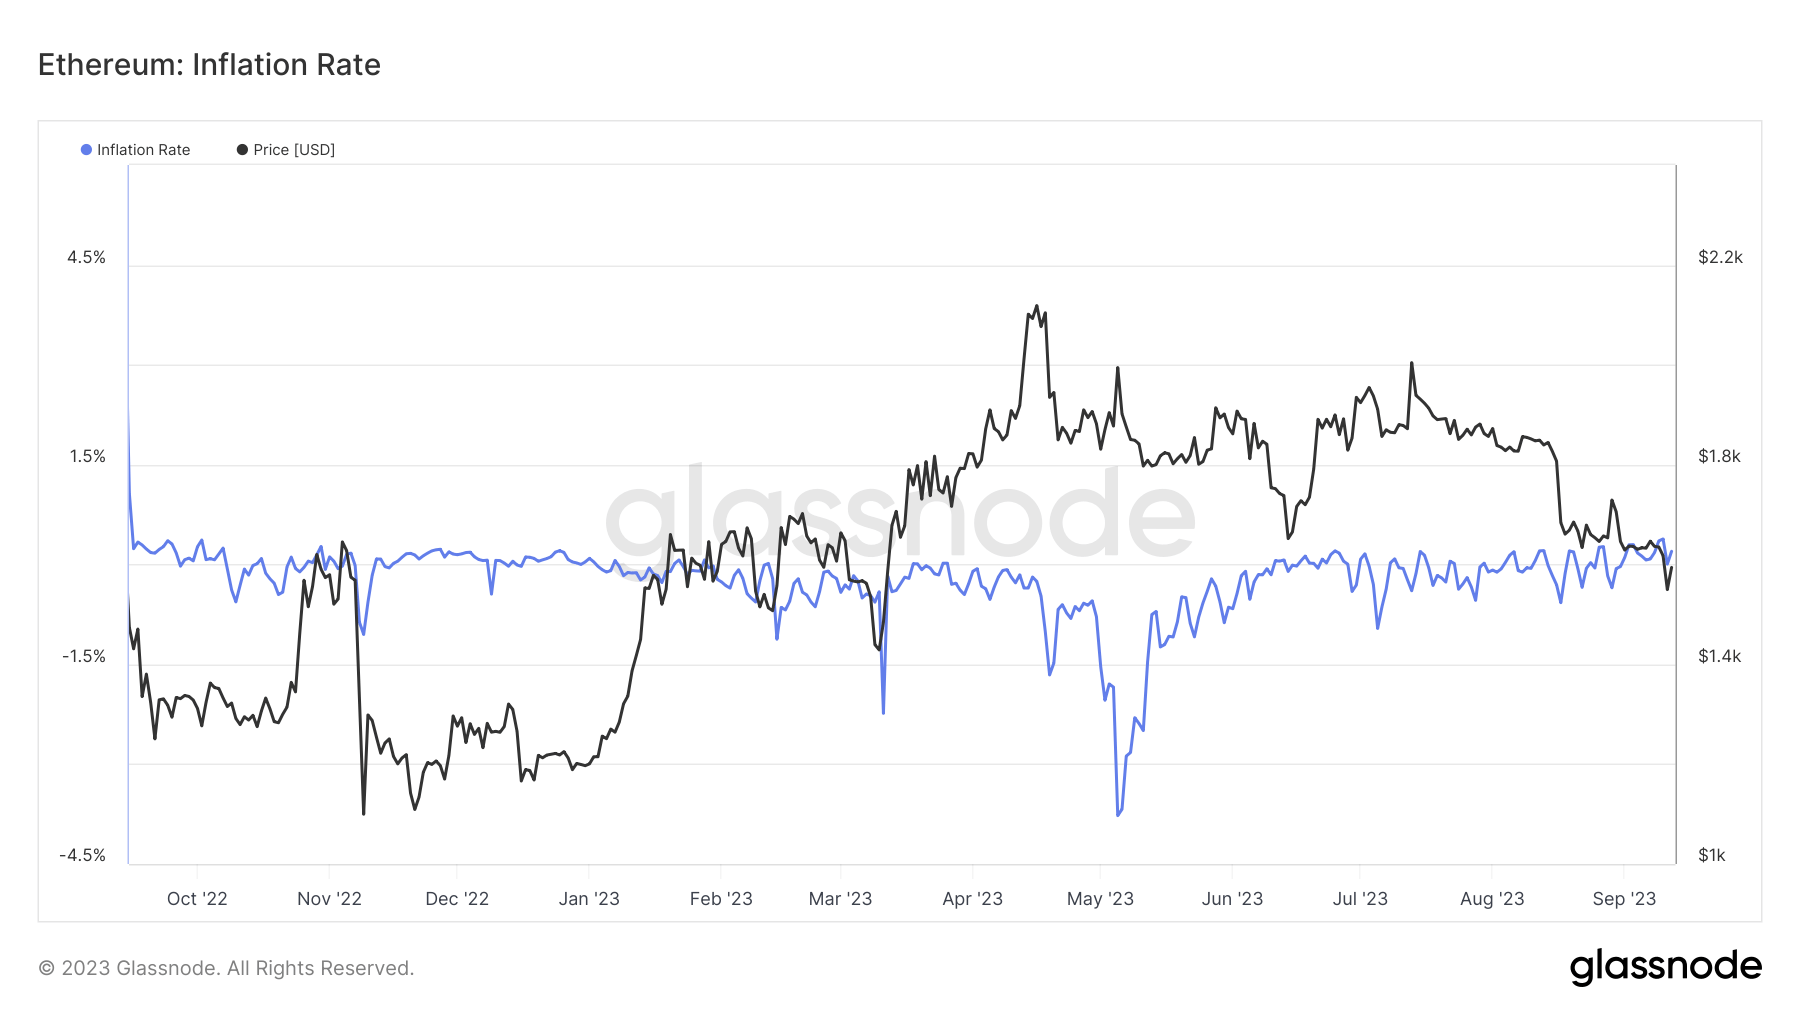
For the broader cryptocurrency market, Ethereum’s supply dynamics post-merge serve as a case study in balancing network security with economic incentives. Ethereum’s oscillations highlight the challenges and complexities of managing a cryptocurrency’s monetary policy in a decentralized ecosystem.
Further, they can make it hard for investors and users to predict its economic future, potentially leading to decreased demand for the volatile asset.
Ethereum’s supply dynamics since the Merge underscores the intricate interplay between technical upgrades, economic incentives, and market forces.
The post Analyzing Ethereum’s inflationary and deflationary supply trends appeared first on CryptoSlate.
Credit: Source link